BME100 f2016:Group5 W1030AM L3
Mean and Standard Deviation
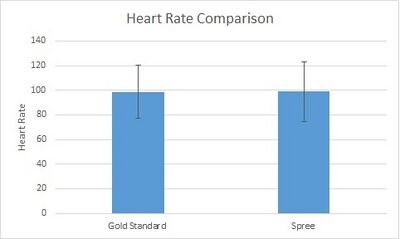
The mean for heart rate for Gold Standard is 98.767 and the standard deviation for Gold Standard is 21.697.
The mean for heart rate for Spree is 99.147 and the Standard deviation for Spree is 24.274.
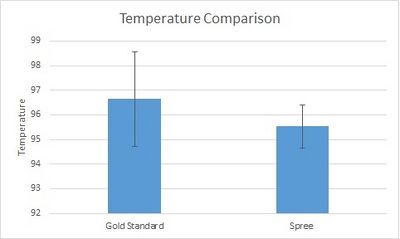
The mean for temperature for Gold Standard is 96.647 and the standard deviation for Gold Standard is 1.923.
The mean for temperature for Spree is 95.531 and the standard deviation for Spree is 0.870.
Pearson's r
1. Oral thermometer and Spree band:
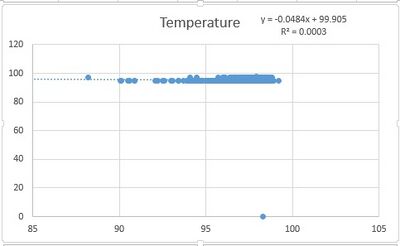
The Pearson's R results for temperature came out to be .0003.
2. Pulse ox and Spree Band:
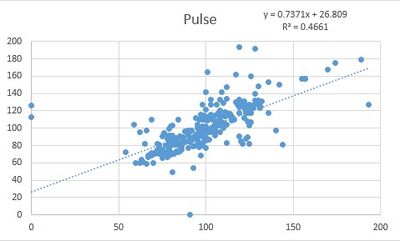
The Pearson's R results for Pulse ox came out to be .4661.
Inferential Statistics
1. Oral thermometer and Spree Band:
For the temperature, T-test gave a value of 1.097*10^-21 which means there is a statistical difference.
2. Pulse ox and Spree Band:
For the heart rate, T-test gave a value of .671 which means there is no statistical difference.
Graph
Summary of results
Regarding the Pearson's R for both tests, the graph showing the relationship between pulse ox of the gold standard and the headband came out to be .4661, this means that there is a slight correlation between the gold standard and the Spree Headband data. For the temperature tests, the Pearson's R came out to be .0003, or in other words, there was no correlation between the gold standard and the headband data.
Regarding the T-Test the heart monitor in the spree band works fine in comparison with the gold standard ox pulse with a p value of .671 indicating that the spree band can measure the heart rate accurately. For the temperature T-test, the spree band does not measure the temperature accurately with a p value of 1.097*10^-21 which indicates that it cannot accurately determine temperature.
Experimental Design of own Device
The experiment that we would use to measure the accuracy of our device would involve blood flow. The way we would do this is by getting 100 test subjects over the age 65 and getting a baseline of how much blood flows through their Jugular Vein. After this we will use a Doppler Ultrasound to record the blood draining from the brain during exercise, rest, and other tasks such as walking. After this we will use the same test subjects and have them wearing the device and perform the same tests however with the flow of blood measured with our device. From there we can graph the two sets of data and see the error variance between the two sets of data and also calculate the inferential statistics, once we calculate this we will see if there is a significant difference between our device and the gold standard which in this case is a Doppler Ultrasound. This will allow us to see if our device is effective if the value for the inferential statistics is less than .05. We can also plot all the data points on to a graph and calculate the Pearson's R of the points, this will show if there is a correlation between activity and blood flow, this would verify our tests. The importance of using an paired group to collect our data is significant because every person is different so using the same group of people to collect the data ensure that human variability is eliminated.


