BME100 f2015:Group9 8amL5
| Home People Lab Write-Up 1 | Lab Write-Up 2 | Lab Write-Up 3 Lab Write-Up 4 | Lab Write-Up 5 | Lab Write-Up 6 Course Logistics For Instructors Photos Wiki Editing Help | |||||||||||||||||||||||||||||||||||||||||||||||||||||||||||||||||||||||||||||||||||||||||||||||||||||||||||||||||||||
OUR TEAM
LAB 5 WRITE-UPPCR Reaction ReportTo set up the the reaction precise measurements of solutions had to be taken using a pipette. One member of the team did the work with the pipette while the other members observed and made sure the correct process was being followed, with the correct measurements. The pre-lab readings helped the team to understand the correct process of pipetting and how important it is to be patient and precise while using a pipette. The first stop on the pipette was used for when a sample liquid was being drawn from a sample tube into the pipette tip. The second stop on the pipette was used for when the sample liquid was released from the tip. To create the solution to be put in the PCR machine, exactly 50 microliters of PCR reaction mix was put in an empty PCR reaction tube then 50 microliters of DNA/primer mix was added, to create a combined solution of 100 microliters. There was extra liquid left in all of the DNA/Primer sample tubes, but there was no remaining PCR reaction mix leftover. For all patient and control samples of DNA and PCR reaction mix, there was not any visible amount liquid left in the sample tubes after being added to separate Buffer tubes. There was 100 microliters of PCR/DNA raction mix in each patient sample and control sample tube. The volume on the pipette was set to 120 microliters to ensure that all of the contents in those tubes were fully removed. Each sample was then added to its corresponding, pre-labeled Buffer tube. The same labeling schemed that was used for the PCR/DNA reaction mix samples was used for labeling the Buffer tubes. Because the Buffer tubes were already distinguished by having a red dot, there was no need to create a different labeling scheme. Fluorimeter ProcedureSmart Phone Camera Settings
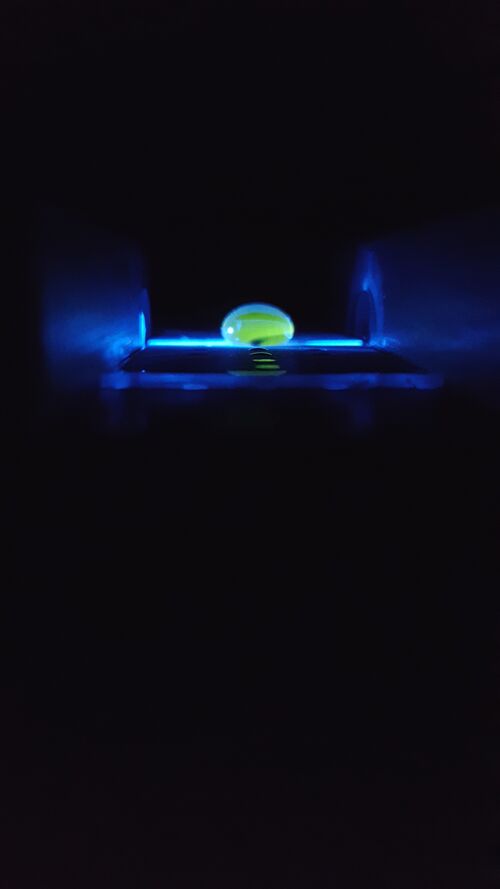
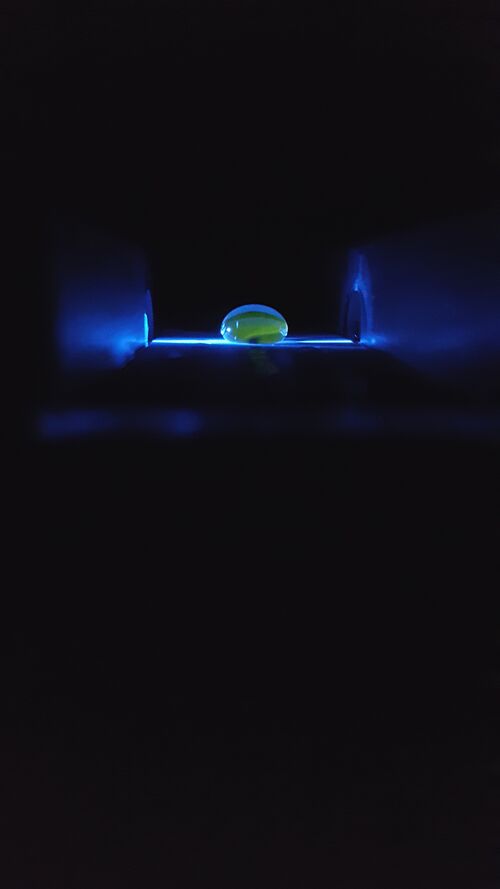
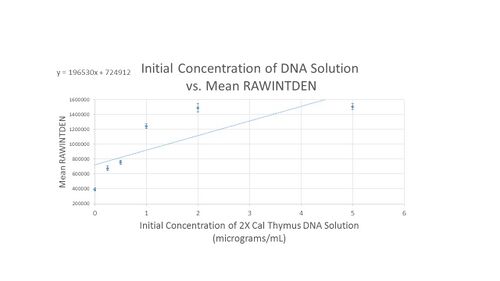
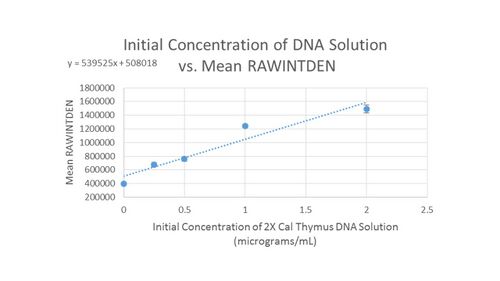
Data Collection and AnalysisImages of High, Low, and Zero Calf Thymus DNA Calibrator Mean Values
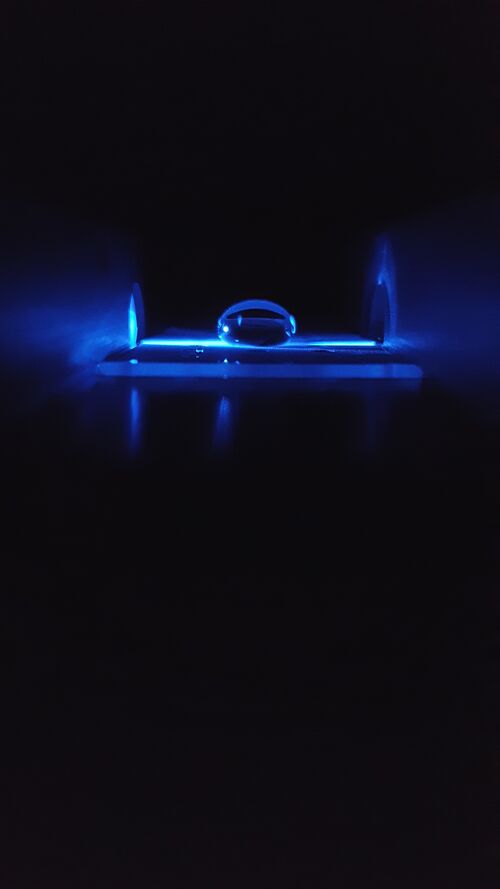
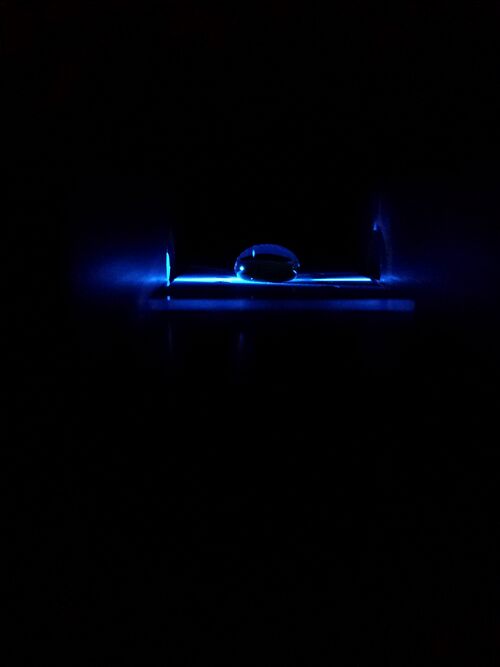
Images of Our PCR Negative and Positive Controls
PCR Results: PCR concentrations solved
PCR Results: Summary
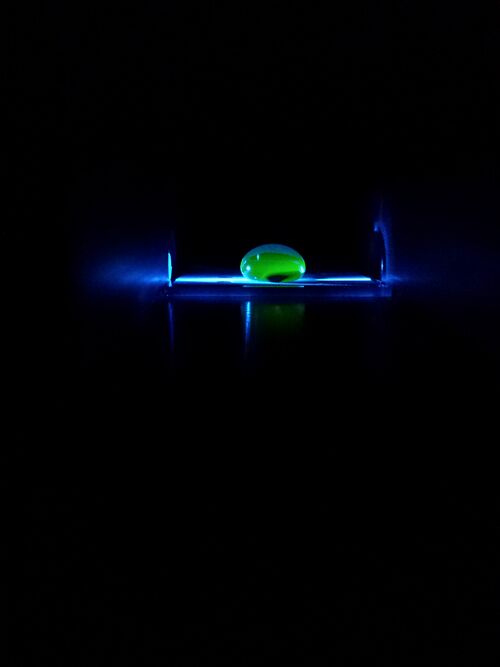
The droplets in the images for this patient were green, and the fluorescence was clearly visible. The three test tubes for this patient gave an average initial PCR Product concentration of 243.52 μg/mL.
The droplets in the images for this patient were green, and the fluorescence was clearly visible. The three test tubes for this patient gave an average initial PCR Product concentration of 219.16 μg/mL.
Because this patient's average initial PCR Product concentration of 243.52 μg/mL was significantly closer to the initial PCR Product concentration of the positive control, we concluded that this patient was positive.
Because this patient's average initial PCR Product concentration of 219.16 μg/mL was significantly closer to the initial PCR Product concentration of the positive control, we concluded that this patient was positive.
| |||||||||||||||||||||||||||||||||||||||||||||||||||||||||||||||||||||||||||||||||||||||||||||||||||||||||||||||||||||


