BME100 f2015:Group9 1030amL2
| Home People Lab Write-Up 1 | Lab Write-Up 2 | Lab Write-Up 3 Lab Write-Up 4 | Lab Write-Up 5 | Lab Write-Up 6 Course Logistics For Instructors Photos Wiki Editing Help | |||||||
|
OUR TEAM
LAB 2 WRITE-UPDescriptive StatisticsHuman Study: Effects of Inflammotin Levels in Elderly Humans Rat Study: Effects of Inflammotin Levels in Rats
ResultsExperiment 1: Effects of Inflammotin Levels in Elderly Humans
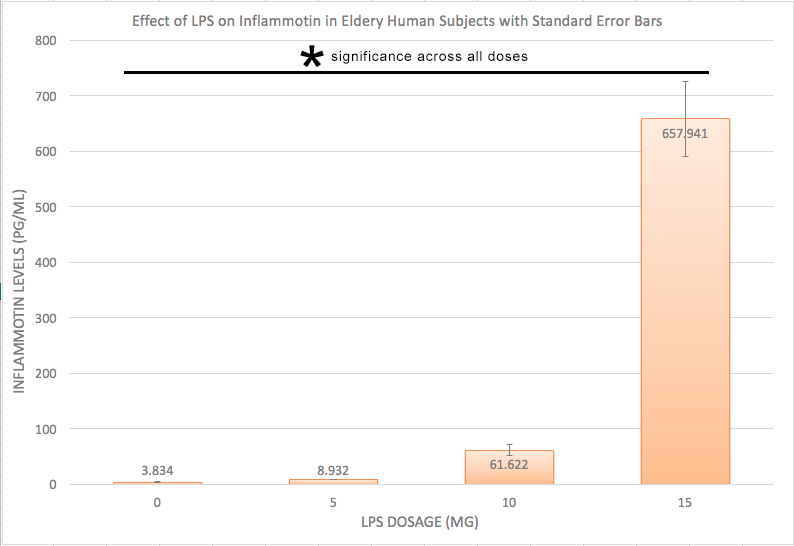
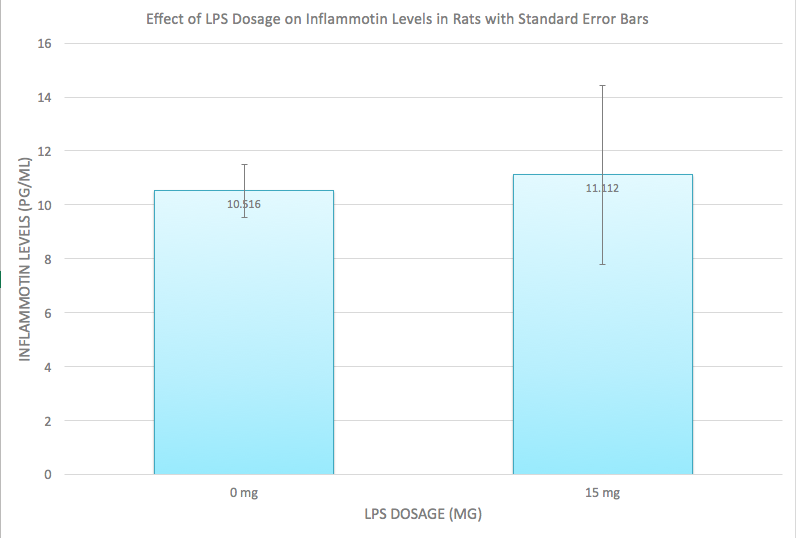
AnalysisExperiment 1 A post-hoc test, also known as a Bonferroni correction, is conducted in order to see the error associated with multiple comparisons. As shown in Figure 1, there is a significant difference among all the the varying doses of LPS given that the adjusted p-value became 0.05/0.4 = 0.0125 Experiment 2 A T-Test was used for the rat study instead of an ANOVA because there are only two groups being compared to see if there is a significant difference. Because the p-value of 0.867403497 is greater than the p-value of 0.05, we can conclude that there is no significant difference between the two dosages within the rats.
Summary/DiscussionExperiment 1 (Humans):
The data recorded from experiment 1 shows that as the mg dosage of LPS increased, the inflammotin level had increased as well, with an exponentially larger increase as the dosage increased. Along with the Standard deviation and Standard error as well. Age appeared to be a negligible difference however. As seen in Figure 1, the inflammotin levels for the 15mg is higher than the 0mg. In order to confirm that there is a significant difference, an ANOVA test was conducted along with a Bonferroni correction in order to take into account of which LPS dosage was significant. This shows that LPS dosage does, in fact have an effect on Inflammotin levels. Experiment 2 (Rats):
The data recorded in experiment 2 shows different results, when the mg dosage increased from 0mg to 10mg, despite the fact that the Inflammotin level for the rats did not appear to be significantly affected by the dosage, there was slight increase of inflammotin levels because there was a slight increase in the inflammotin average, along with the standard deviation and the standard error. This can be seen in Figure 2, as the averages for both Inflammotin levels are about the same level, and as seen in the T-Test, there is no significant difference between the two LPS dosages, indicating that the Inflammotin levels are not significantly affected by LPS dosage. Conclusion: It seems that the dosage increase of mg has a much more predictable and noticeable increase when tested on humans, whereas with rats, the dosage had a very minimal change and may not even be considered as significant change at first glance, but the data shows that there is a minimal change in inflammotin levels as the dosage increases from 0mg to 10mg. This may be due to the fact that humans and rats are genetically built up differently, thus, their reaction to the LPS dosage were different. The patients used in this experiment were elderly as well, which may have affected the results since the rats may have been younger and thus healthier. The results could be improved by taking larger samples for each dosage and for the rat experiment, it may be beneficial to record the reaction to varying amounts of LPS dosage to see if there is a significant difference among varying LPS dosage. |
|||||||


