BME100 f2015:Group8 8amL6
| Home People Lab Write-Up 1 | Lab Write-Up 2 | Lab Write-Up 3 Lab Write-Up 4 | Lab Write-Up 5 | Lab Write-Up 6 Course Logistics For Instructors Photos Wiki Editing Help | |||||||
|
OUR COMPANY
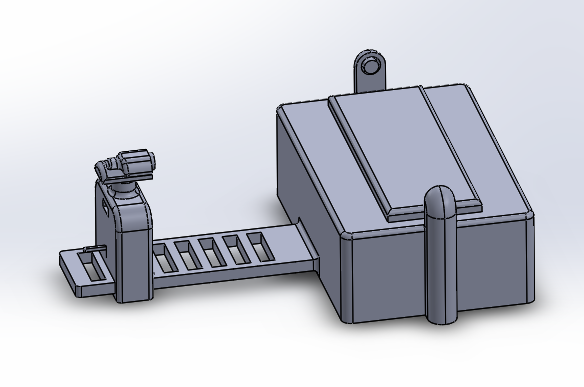
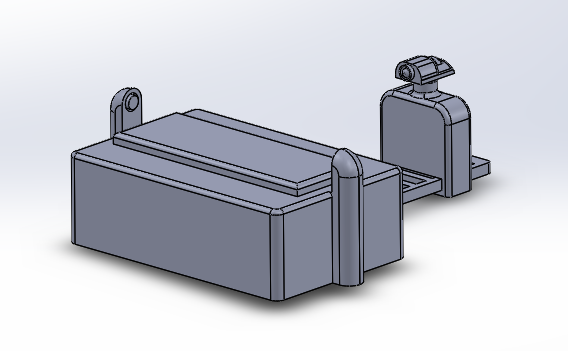
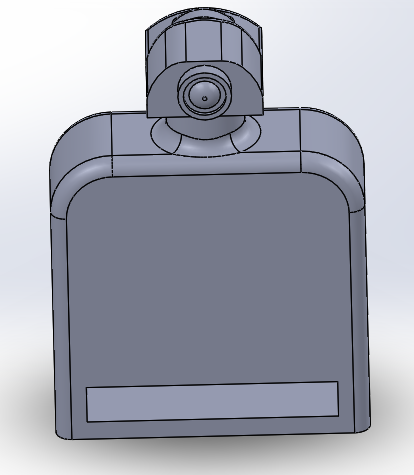
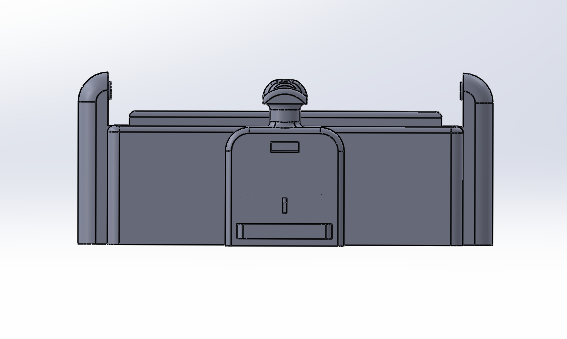
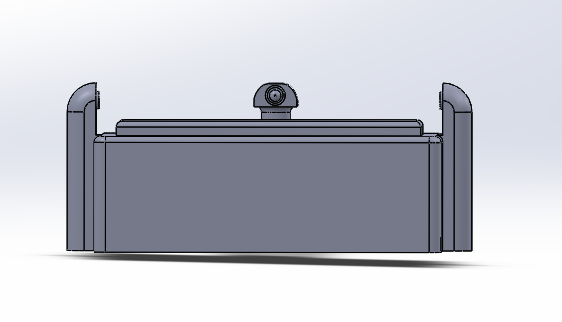
LAB 6 WRITE-UPBayesian StatisticsOverview of the Original Diagnosis System The objective of our lab was to identify an unknown SNP which causes a disease. We had 34 patients and 17 groups. Each group consisted of 5-6 students and each group was assigned two patients at random. We were assigned to identify if the patients were positive or negative for the SNP using PCR and ImageJ to collect data and make a conclusion. We used three replicants per patient to increase the validity of our test results. We wore lab coats and gloves to prevent contaminating the PCR samples that contained our patients DNA, the buffer solution, and the SYBRGreen1. After our samples went through our PCR cycles we carefully placed droplets of the samples onto slides placed on a fluorimeter. The fluorimeter emitted a light which shined through our sample droplet. We then used a smart phone camera to take pictures of the droplets. In total we took 60 pictures of 18 replicants of our patients DNA and our positive and negative control. We analyzed theses pictures through ImageJ to find the area, integrated density, standard deviation, mean gray value and modal. These parameters were able to help us see how much SYBRGreen1 was present in the droplet sample which indicated to us whether the patient was positive or negative. High concentrations of SYBRGreen1 showed that the patient was positive for the disease SNP. Low concentrations indicated that the SNP was not present in the patient. The class's final data from the BME100_Fa2015_PCRresults spreadsheet provided us the total positive and negative PCRs, total positive PCRs with positive test conclusions, and total negative PCRs with negative test conclusions. Furthermore it provided us their final test conclusion of whether or not the patient has the disease. 6 groups did not provide a test results leaving us with 28 total diagnoses. Only 8 groups diagnosed the patient with the disease. What Bayes Statistics Imply about This Diagnostic Approach Calculation 1 and 2 For calculation 1 the probability that a patient will get a positive final test conclusion, given a positive PCR reaction is 85%. Calculation 2 the probability that a patient will et a negative final test conclusion, given a negative diagnostic signal is 95%. Therefore we can can conclude that our PCR reactions were able to better identify negative reactions than positive reactions. Calculation 3 and 4 The probability that a patient will develop the disease given a positive final test conclusion is 25%. The probability that a patient will not develop the disease given a negative final test conclusion is .69%. This indicates that both of our PCR reactions are not reliable at detecting whether or not a patient will develop the disease. Sources of Human and Mechanical/Device Error We were able to identify three possible sources of error are inconsistent distance from sample, camera angle, and quality of picture. Some groups may have failed to adjust the distance between the smart phone and fluorimeter to view the drop closely while keeping it in focus greater than 4cm away. In regards to the camera angle groups may have failed to adjust the height of the fluorimeter to get a camera view of the slide nearly edge-on. Our finally source of error was from poor quality photos. There is a possibility that the groups were not able to produce good quality photos droplets which could have prevent ImageJ from analyze them and creating inaccurate data. This would have most likely occurred it the groups smart phone did not have high exposure or saturation of light to fully capture the droplet on the slide. Intro to Computer-Aided DesignTinkerCAD Our Design
Feature 1: ConsumablesSmaller glass slides Camera cord By having smaller slides we see some minor weaknesses to the design of our device. Smaller glass slides decreases the amount of samples that we can put onto the slide. The normal slides will allot about 5 samples per slide. Ours would reduce this to three due the shortened length of our slides to accommodate for the reduction of our fluorimeter. This means that if researchers need to analyze many sample from a PCR they will have to replace the glass slide more often. Feature 2: Hardware - PCR Machine & Fluorimeter
| |||||||


