BME100 f2015:Group8 1030amL3
| Home People Lab Write-Up 1 | Lab Write-Up 2 | Lab Write-Up 3 Lab Write-Up 4 | Lab Write-Up 5 | Lab Write-Up 6 Course Logistics For Instructors Photos Wiki Editing Help | |||||||
|
OUR TEAM
LAB 3A WRITE-UPDescriptive Statistics
Results
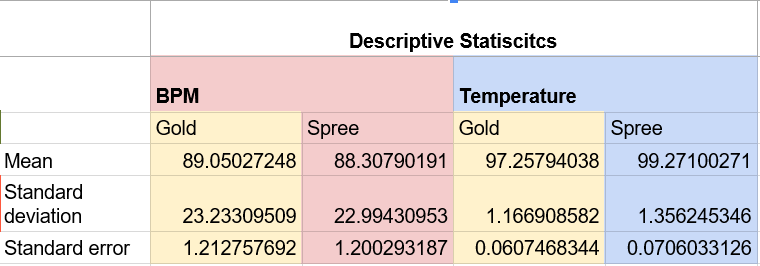
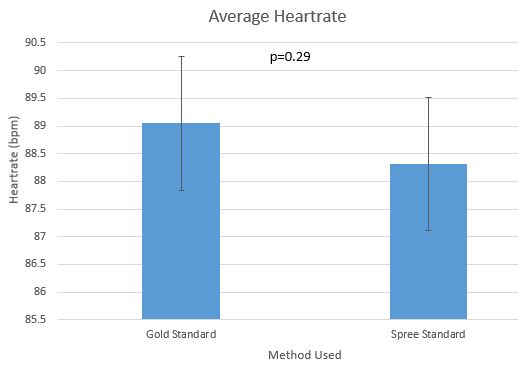
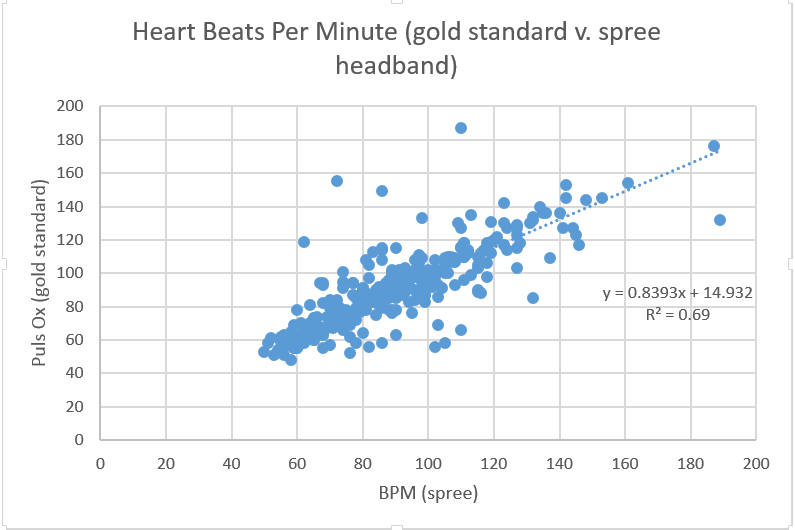
AnalysisThe Gold Standard of BPM v. Spree Band BPM: The average of the Gold Standard BPM was 89.05 BPM and the average of the Spree Band was 88.31.The standard deviation of the Gold Standard BPM data was 23.23 and the standard deviation of the Spree Band BPM values was 22.99. The averages are very close to one another, therefore alluding to a close relationship between the two devices measuring heart rate. When a paired t test was performed to analyze the data, a p-value of .29111 was calculated. Therefore, when compared with an alpha of .05, the value is insignificant. From this, one can conclude that there is no significant difference between the heart rate recorded by the Spree Band and the Gold Standard.
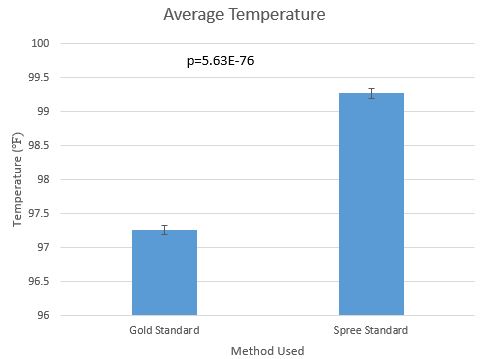
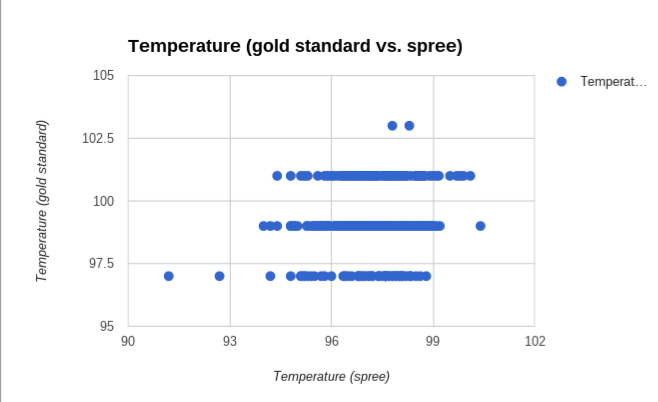
Temperature of the Spree Band v. Temperature of the Gold Standard: The average of the Spree Band Temperature was 99.27 and the average of the Gold Standard Temperature was 97.26. The standard deviation of the Spree Band Temperature 1.36 and the standard deviation of the Gold Standard Temperature was 1.67. The data of the Spree Band temperature was assigned a value based on a scale of 1 to 4. This made the data very unreliable, in turn foreshadowing a difference in the measurement techniques of the Gold Standard versus the Spree Band. When a paired t test was performed to analyze the data, a p-value of 5.63x10^-76 was calculated. Therefore, since the p-value was so low, a significant difference between the temperature recorded by the Spree Band and the temperature recorded by the gold standard of the thermometer was found. In conclusion, the temperature measured by the Spree Band is not as accurate as the temperature measured by the thermometer.
Summary/DiscussionSome of the design flaws in this experiment include the colored temperature scale on the Spree Band. The temperature is not accurate when compared to the "golden standard" (a thermometer) because there is not a numerical value assigned to the temperature of the spree band user. The sweat of the user impacted the temperature recorded by the spree band, as the sweat blocked the sensor. Another design flaw comes from the physical design of the headband, as the user complained that it was uncomfortable and tight on the forehead. It was also not aesthetically pleasing. In order to repair these design flaws, the Spree Band should be adjustable to ensure that the band is not tighter on individuals with larger heads. A sweat-proof sensor would also be useful so that sweat will not interfere with the pulse and temperature readings. The Spree Band could also be made with a more comfortable material, as the user would be wearing the band during physical exercise. The temperature method should also be changed to give actual numerical values in Celsius or Fahrenheit rather than a visual temperature scale in order to record more accurate temperatures.
LAB 3B WRITE-UPTarget Population and NeedThe Sun Sounds target population will be college students who are wanting to fight the freshman fifteen. This device is stylish and comfortable to wear during a workout. College students have a great deal of stress in their lives: stress that they can relieve by working out. For college students are further stressed out by the fear of the "freshman fifteen," the Sun Band allows students to measure their heart rate and temperature during a workout to achieve an optimum work. The Sun Sounds also is made at a low cost, therefore making the product affordable to the college student population. Sun Sounds are also wireless Bluetooth headphones that can connect to the user's phone during a workout and play music without the hassle of the wire.
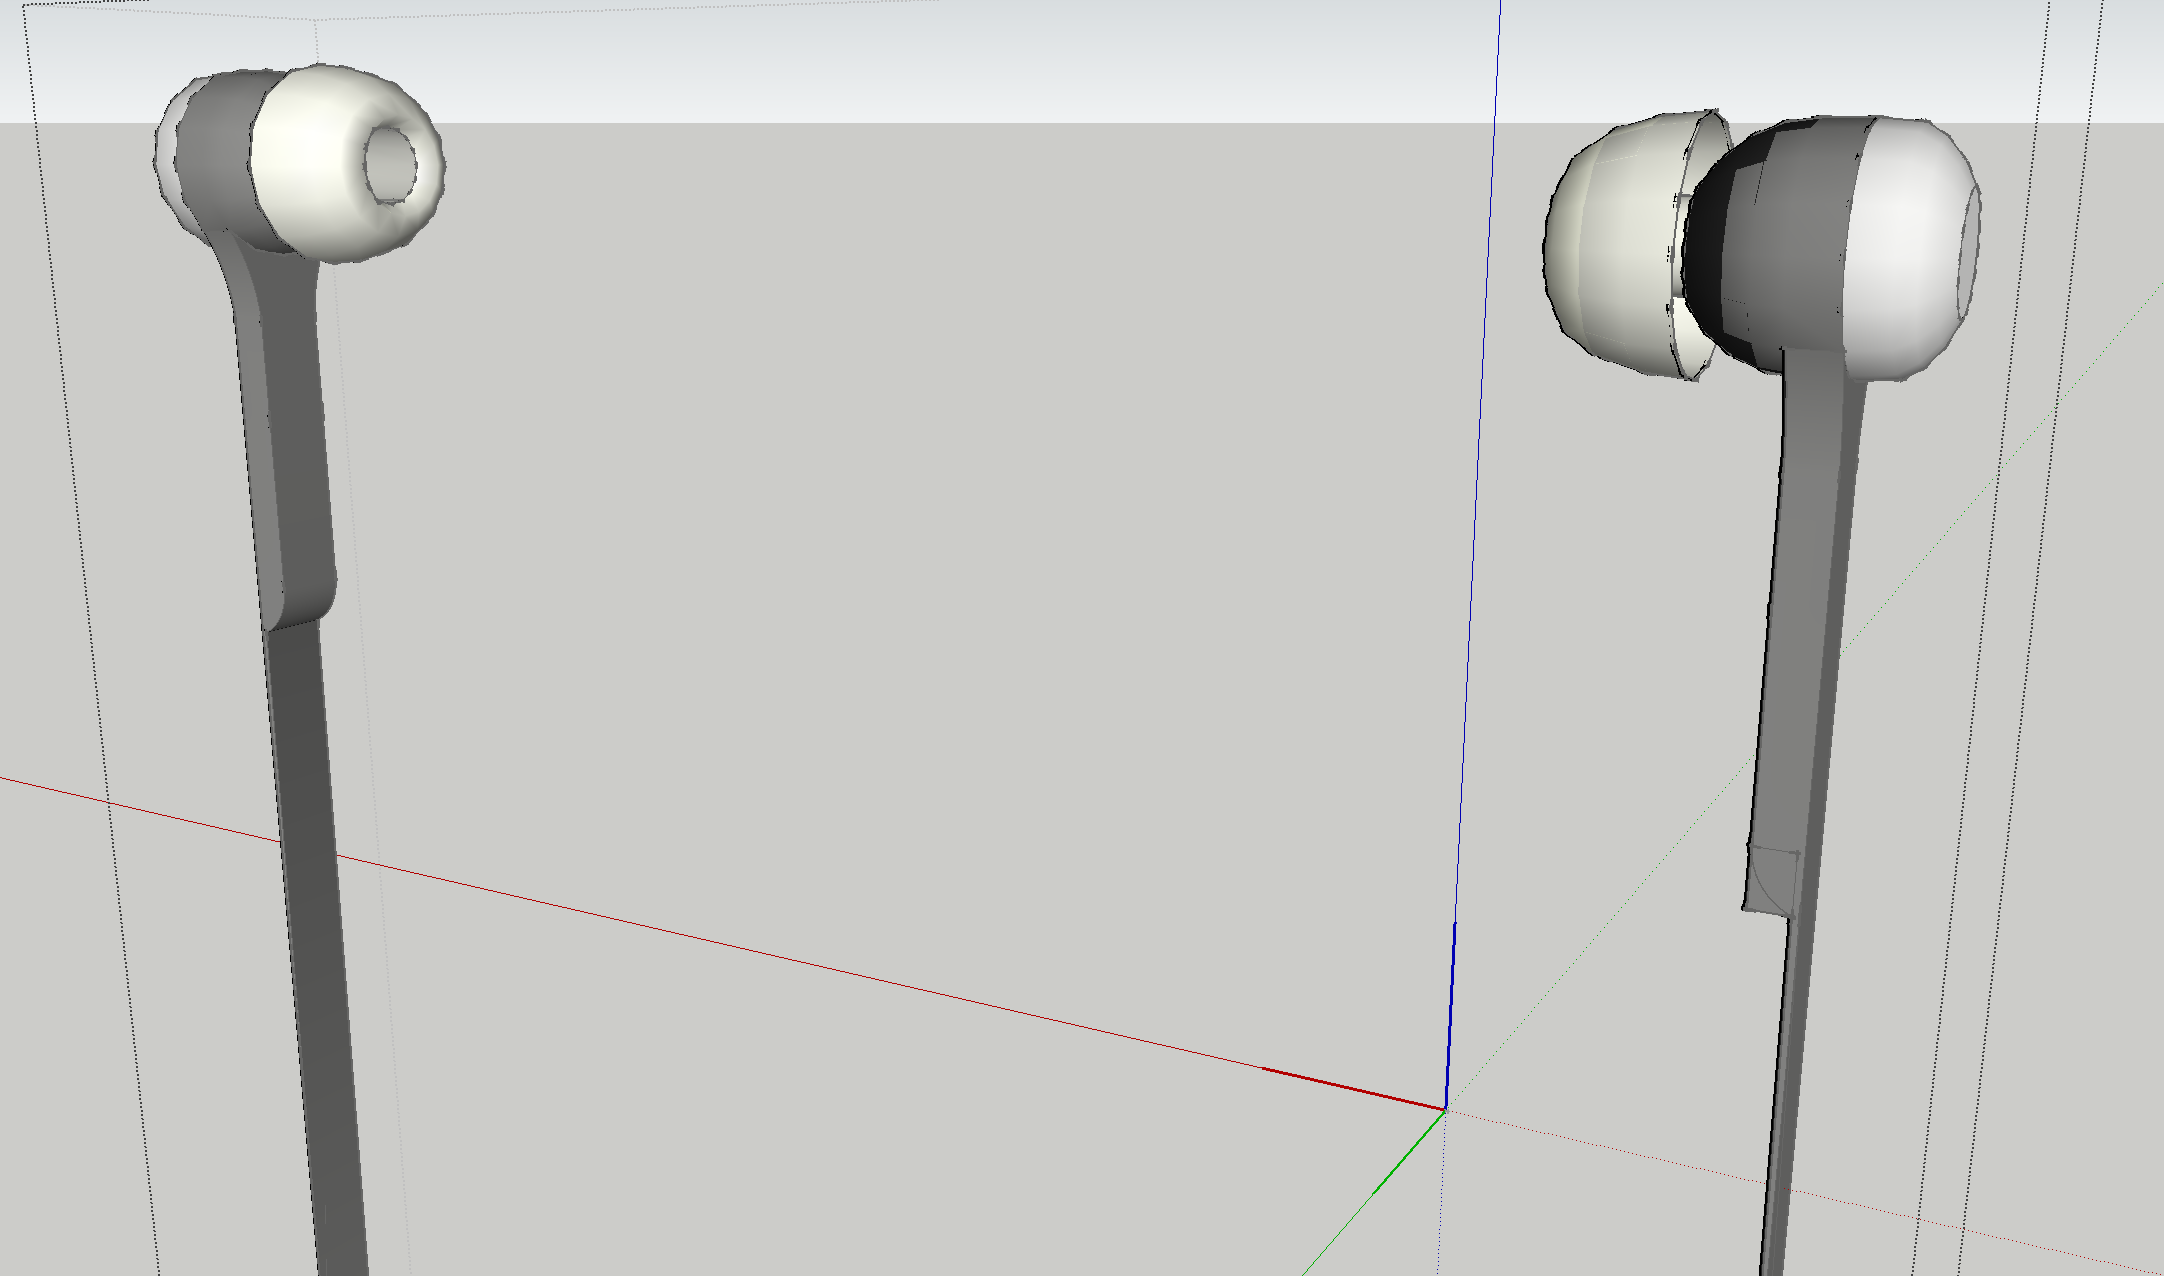
Device Design
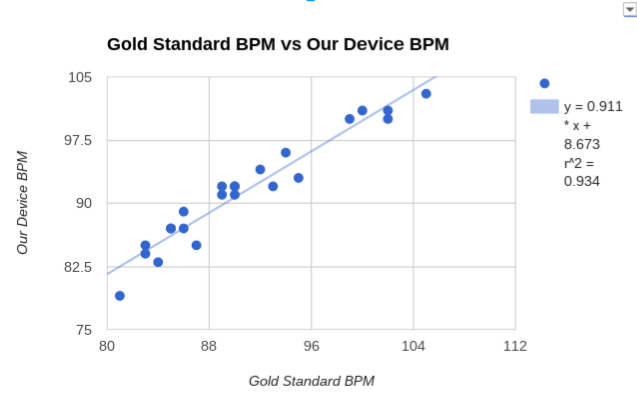
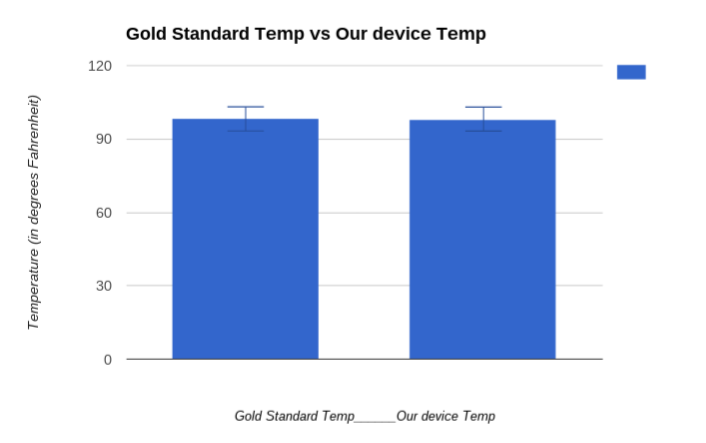
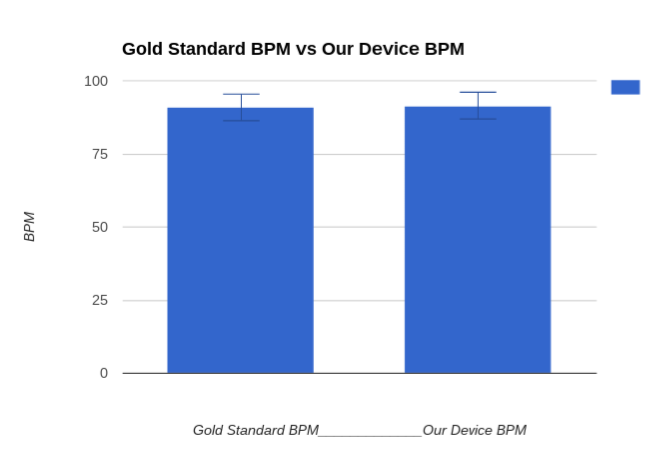
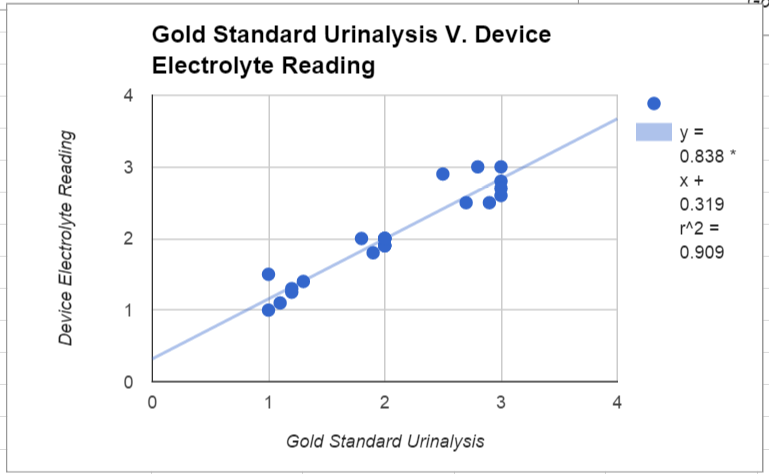
Inferential StatisticsAn unpaired two sample t test was conducted to determine the reliability of the Sun Sounds against the Gold Standards of measurement for the heart rate, temperature, and electrolyte concentration. The p-value calculated for the comparison of temperature of the gold standard and the temperature of the Sun Sounds was .4786 which indicates that there is no significant difference between the gold standard of measuring temperature and the Sun Sounds method of measuring temperature. The p-value calculated for the comparison of heart rate of the gold standard and the heart rate measured by the Sun Sounds was .7587 which indicates that there is no significant difference between the gold standard of measuring heart rate and the Sun Sounds method of measuring heart rate. The p-value calculated for the comparison of the electrolyte concentration in the users body using the gold standard of a urinalysis and the Sun Sounds measurement of electrolyte concentration using the sweat secreted by the body was .7399, therefore there is no significant difference between the two methods of measurements according to the unpaired two sample t test.
Graph
|
|||||||

