BME100 f2015:Group6 1030amL3
| Home People Lab Write-Up 1 | Lab Write-Up 2 | Lab Write-Up 3 Lab Write-Up 4 | Lab Write-Up 5 | Lab Write-Up 6 Course Logistics For Instructors Photos Wiki Editing Help | |||||||||||||||||||||||||||||||||||||||||||||||||||||||||||||||||||||||||||||||||||||||||||||||
|
OUR TEAM
LAB 3A WRITE-UPDescriptive Statistics
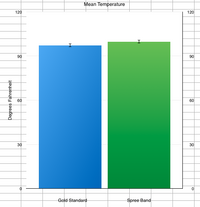
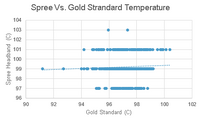
ResultsTemperature Heart Rate
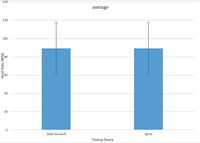
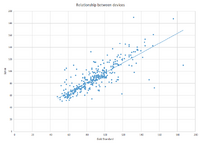
AnalysisFor the heart rate study a paired T-test was done to determine significance. A paired t-test was done because the subjects that used the Spree headband were the same subjects who used the gold standard. For the heart rate test, the p-value was 0.3902. This value shows that there was not significance between the gold standard and the spree head band because p>.05. This suggests that the Spree headband is not an accurate device to measure heart rate. A scatter plot for the data was also made and Pearsons' R coefficient was 0.8233. This means that the Spree headband has a moderately positive relationship with the gold standard but not a significant relationship. In combination with the t-test, it can be said with certainty that there is not a strong relationship between the data collected from the Spree headband and the data from the gold standard device.
Summary/DiscussionThere are many design flaws with the Spree fitness headband. First, it's difficult to connect with to Bluetooth and this took several minutes. The bluetooth device in the headband should be stronger and able to deal with high traffic in case multiple people were wearing them in the gym. Another flaw was that only levels of temperature are shown instead of the degree values. This would be a simple fix within the app to show the degree value since the device needs to take the person's temperature to put it in a temperature level. A third technical flaw was the erratic heart rate readings that were inconsistent with the changes in temperature. This is a sensitivity error on the device's half which could be fixed by a more consistent and reliable heart rate monitor. Aside from the technology, the band is very expensive in comparison to the quality. There's many fitness devices in the market that are more popular because they're lower in price and higher in quality. The company should lower the price to something more reasonable around seventy-five to one hundred dollars. After wearing it for an hour, the band gave the wearer a headache and left strange imprints on their forehead. A fix for this would be to place the band somewhere other than the head, such as around the arm, which would make it more aesthetically pleasing as well.
LAB 3B WRITE-UPTarget Population and NeedOur target population consists of people in high stress, physically demanding jobs such as firefighters or military officers. The problem is that the demanding nature of these jobs can cause negative effects on the body. Often in tense situations, subjects could become dehydrated or overheated, leading to unconsciousness or death. The goal is to know when the subject is approaching a dangerous level of dehydration, temperature, or oxygen level and take action to prevent harm. Thousands of people across the globe could benefit from this device, from a hiker in the Rocky Mountains to a CIA agent in Syria. However, the expense and medical implantation of the device would limit the number of people who can use it.
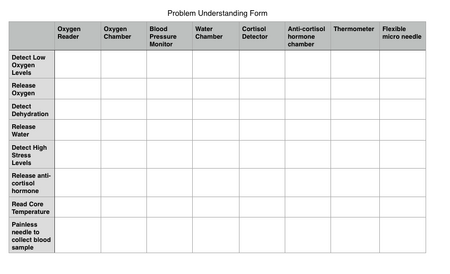
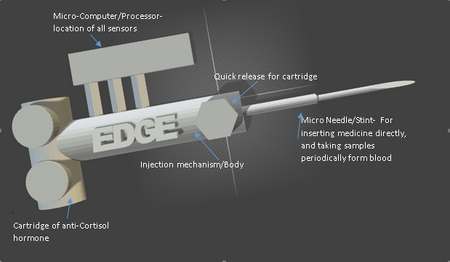
Device DesignThis device is a microneedle analysis implant that is virtually painless and monitors different levels of substances in the blood. Inserted into a the forearm, blood runs through the monitoring system and data is collected. A computing system determines when the vital levels are low and certain chemicals are released to begin to return vitals to normal ranges.
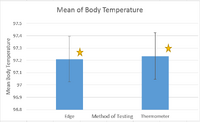
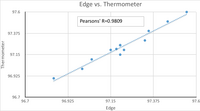
Inferential StatisticsIn this experiment, a group of 25 people use the gold standard thermometer every 2 minutes for ten minutes inside, every five minutes for forty minutes outside doing activity, and finally every 2 minutes for 10 minutes inside during a cool down. Then, the subjects would repeat the process using the Edge, recording their temperature at the same intervals.
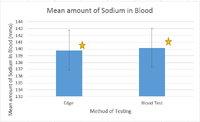
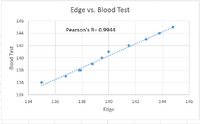
In this experiment, a group of 25 people use the gold standard blood test every 5 minutes for 25 minutes inside, every 10 minutes for one hour twenty minutes outside doing activity, and finally every 5 minutes for 25 minutes inside during a cool down. A small blood sample was taken and then analyzed to determine the amount of Sodium present in the blood. Then, the subjects would repeat the process using the Edge, recording their Sodium levels at the same intervals.
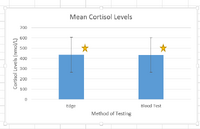
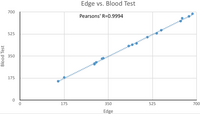
In this experiment, a group of 25 people use the gold standard blood test every 5 minutes for 25 minutes inside, every 10 minutes for one hour twenty minutes outside doing activity, and finally every 5 minutes for 25 minutes inside during a cool down. A small blood sample was taken and then analyzed to determine the amount of Cortisol present in the body. Then, the subjects would repeat the process using the Edge, recording their Cortisol levels at the same intervals.
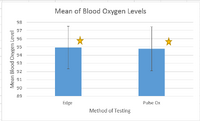
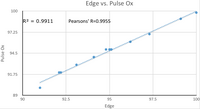
In this experiment, a group of 25 people use the gold standard pulse ox every 2 minutes for ten minutes inside, every five minutes for forty minutes outside doing activity, and finally every 2 minutes for 10 minutes inside during a cool down. Then, the subjects would repeat the process using the Edge, recording their blood oxygen level at the same intervals.
GraphCortisol Levels
Oxygen
|
|||||||||||||||||||||||||||||||||||||||||||||||||||||||||||||||||||||||||||||||||||||||||||||||

