BME100 f2015:Group5 8amL6
| Home People Lab Write-Up 1 | Lab Write-Up 2 | Lab Write-Up 3 Lab Write-Up 4 | Lab Write-Up 5 | Lab Write-Up 6 Course Logistics For Instructors Photos Wiki Editing Help | |||||
|
OUR COMPANY
LAB 6 WRITE-UPBayesian StatisticsOverview of the Original Diagnosis System PCR is a technique that is used to detect a disease-associated DNA sequence (SNP). The labor for the class was divided by 17 teams of 6 students, each team being assigned to two patients. To prevent diagnosing errors, each patient was tested three times by each group for accurate replication and to add certainty. The PCR controls were simply laid out and presented in a manner that the students could easily manipulate them to the exact specifications of the lab. for ImageJ and fluorimeter, a micropippetter was used to ensure accuracy for the drops. Then for the photos, the camera settings were held constant for each photo. Each sample was tested three times, by using three separate drops in the fluorimeter. Based upon the final data of the class, the conclusions drawn by the PCR labs were relatively accurate as all were at or above 77% correlating data with test information within calculations 1 and 2. What Bayes Statistics Imply about This Diagnostic Approach For calculation 1, the correlation between positive PCR tests and Positive final test conclusions was nearly 1, with the value for the probability of a final test conclusion given a Positive PCR reaction being only a slightly lower value. For calculation 2, the probability of a negative PCR reaction given negative final test conclusion is close to .75, which isn't nearly as accurate as all other values. The probbility of a negative final test conclusion given a negative PCR reaction is a very high value close to 1. This shows a strong positive correlation and a high accuracy value for the tests.
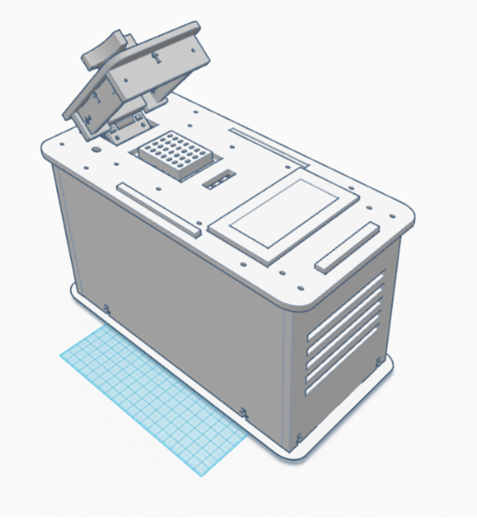
Each of these would result in less accurate data and less conclusive PCR tests, which would ultimately lead to an increased probability for misdiagnoses of the patients. Intro to Computer-Aided DesignTinkerCAD The team uploaded the components of the PCR to TinkerCAD and assembled it using the software. TinkerCAD was fairly easy to use and build with. Each part was easy to add into the project and manipulating their design was simple. Solid Works would have been more difficult to use for this part of the design. The assembly was more difficult to do in TinkerCAD than it would have been in Solid Works because each of the parts were assembled and grouped when they look like they are aligned instead of being able to mate the pieces which guarantees they are lined up correctly. Our Design
The improved PCR has two major changes to its structure that would allow for it to run more efficiently. The first change is to the heating block which is modified to hold more samples than the current OpenPCR machines. The fan was also made larger and more efficient to cool the samples faster after heating. These design features were chosen to make the PCR machine more efficient than the current OpenPCR machine by increasing the number of samples tested and decreasing the time it takes to test the samples. The Fluorimeter process remains unchanged in the design. This design was made to reduce any error that could occur with a standard PCR machine.
Feature 1: ConsumablesAdditional Supplies:
Feature 2: Hardware - PCR Machine & FluorimeterThe fluorimeter will not be included in the PCR design. The fluorimeter will be a separate component from the new PCR machine. This new design will utilize more effective heating and cooling components. Additional cooling and heating elements will be put in for efficiency. A PCR requires heating and cooling at precise moments in time. The addition of the new components will be tested to heat and cool the samples at a more precise time for maximum efficiency. The OpenPCR machine does not hold enough tubes. The redesign will hold more tube in case a bigger experiment needs to be carried out. To do that, a bigger cover must be made to accommodate the change in size of the compartment.
| |||||


