BME100 f2015:Group4 8amL6
| Home People Lab Write-Up 1 | Lab Write-Up 2 | Lab Write-Up 3 Lab Write-Up 4 | Lab Write-Up 5 | Lab Write-Up 6 Course Logistics For Instructors Photos Wiki Editing Help | |||||||
|
OUR COMPANY
LAB 6 WRITE-UPBayesian StatisticsOverview of the Original Diagnosis System In BME100, 17 groups of 6 students each individually diagnosed 2 different patients, for a total of 34 patients that were tested and diagnosed for the disease-associated SNP. In order to prevent error, each patient had 3 replicates, for a total of 6 replicates, and a positive and negative control that were tested. After these solutions were put through the PCR machine and mixed with a bit of SYBR Green I, a drop from each solution was placed on a fluorimeter and analyzed by a software called ImageJ in order to analyze the fluorescence in the drop. The calibration process for the fluorimeter included placing a drop of just water on the slide and then processing that in ImageJ. This serves the purpose of calibration because it allows for comparison of this purely water sample to our other solutions that contained actual DNA. In order to get the most accurate data for our PCR samples, three images per unique PCR sample were taken, and all three were analyzed. After the class data was compiled, three of the 17 groups contained at least one patient whose data was inconclusive. Three other groups had no test at all, and this blank data reduced the amount of total data that the class could use to complete statistical analysis. The remaining 11 groups came to successful conclusions for their respective patients. One challenge that we encountered throughout this procedure was that the fluorimeter set-up was often flawed; for example, occasionally, the light from the fluorimeter may not have directly passed through the center of the drop, leading our ImageJ analytical data to be skewed.
The results of calculation one implied that there was a high probability that a positive PCR reaction would occur given a positive final test result since the result was close to 1.00 (100%). This showed that the PCR was accurate in providing an accurate positive test result. Calculation 2 was even closer to 1.00 (100%), implying that there was an even higher probability that a negative PCR reaction would occur given a negative test result. The result of calculation 3 was low and much closer to 0.0 than 1.00. This implied that there was a low probability that a patient would develop the disease given a positive test result. This showed that the PCR machine was not accurate in predicting the disease. Calculation 4 was closer to 1.00 than 0.0, although the value was still relatively low. This value implied that there was a moderate chance of the patient not developing the disease given a negative test result. Therefore, the PCR machine was better at predicting when a patient would not develop the disease than when the patient would develop the disease. Poor pippetting techniques could have led to inaccurate values. Although preventative measurements were taken (gloves and lab coats), the vials could have become contaminated. Incorrect use of the fluorometer could have lead to inaccurate results. Light could have gotten into the device, resulting in poor picture quality. Intro to Computer-Aided DesignTinkerCAD
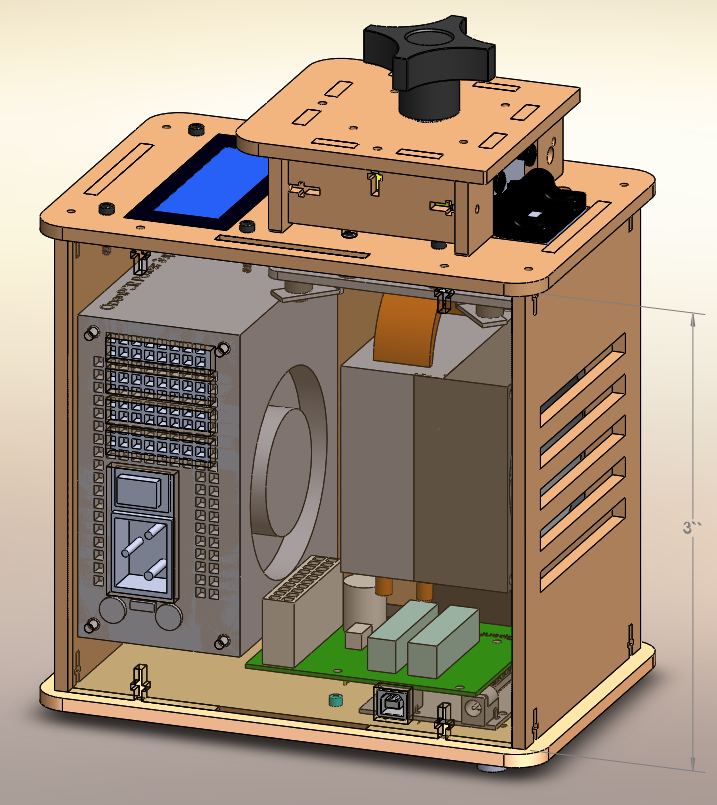
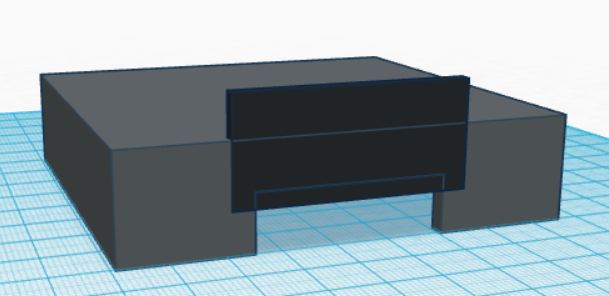
Feature 1: Consumables"Very important" implies that these items only fit with one specific product and cannot be purchased elsewhere. Since our PCR design is smaller than the previous design, we would include tubes to fit with the new design, since those wouldn't be readily available elsewhere. The other items (PCR mix, primer solution, SYBR Green solution, buffer, pippette, and tips) would be purchased separately as they can be used with any PCR machine. The SYBR Green solution would be contained in dark plastic so as the light would not affect the chemical composition and effectiveness. This would also lower the cost of packaging and manufacturing our product. Feature 2: Hardware - PCR Machine & FluorimeterOur group has decided to shrink the size of the actual PCR machine in order to make it less hefty and tedious to carry around. As for the inner mechanisms of the PCR machine, they will also become smaller in order to accommodate for this adjustment. Because the heating and cooling systems are being shrunk, we will need systems with the capability of utilizing large amounts of power as to avoid an increase in the time it takes to complete the PCR process. We are changing the fluorimeter to contain a moving screen that will close the box and prevent any extraneous light from entering, similar to how a garage door works, instead of a loose flap that must be manually closed. We plan to change this feature in order to decrease the chances of light entering and messing up the data collected.
| |||||||


