BME100 f2015:Group3 1030amL6
| Home People Lab Write-Up 1 | Lab Write-Up 2 | Lab Write-Up 3 Lab Write-Up 4 | Lab Write-Up 5 | Lab Write-Up 6 Course Logistics For Instructors Photos Wiki Editing Help | |||||||
|
JOSIE AND THE PUSSYCATS
LAB 6 WRITE-UPBayesian StatisticsOverview of the Original Diagnosis System
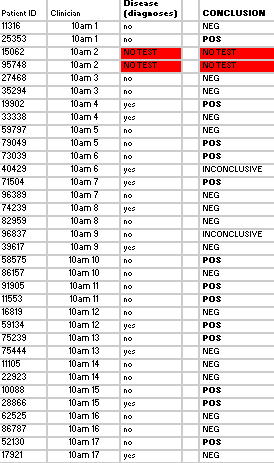
Several measures taken during the lab process to prevent error were the number of replicates per patient, the additon of PCR negative and positive control samples, ImageJ calibration controls when taking the area, mean px value, and RAWINTDEN for each PCR and calf thymus drop amounts, and taking 3 drop images for the ImageJ calculations (per unique PCR sample). From the class's final data from the "BME100_Fa2015_PCRresults" spreadsheet, there were 30 successful conclusions, 2 inconclusive results, and 2 blank data (listed as "NO TEST") as shown: 
Calculations 1 and 2 implied that that the reliability of the individual PCE replicates for concluding that a person has the disease SNP was very high. In calculation 1, it showed that there was a close to 0.85 (84.6%) chance that there would be a positive PCR given a positive final test conclusion and a close to 0.77 (76.7%) chance of a positive final test given a positive PCR reaction, demonstrating that correctly diagnosing a patient with the disease has a very high probabilities. In calculation 2, there was nearly a 90% chance (89.4%) that there would be a negative diagnostic given a negative conclusion result and over 95% chance (96.9%) of a negative final test given a negative diagnostic signal. Calculation 2 results are also very high in predicting correct results of patients. Calculation 1: What is the probability that a patient will get a positive final test conclusion, given a positive PCR reaction? Calculation 2: What is the probability that a patient will get a negative final test conclusion, given a negative diagnostic signal? Calculations 3 and 4 implied that that the reliability of the individual PCR replicates for concluding that a person has the disease SNP was highly varied and not accurate. In calculation 3, it showed that there was a small chance (30.8%) that there would be a positive PCR given a that the patient will develop the disease and an even smaller chance (23.7%) that a patient will develop the diesase given a positive final test conclusion. Calculation 3 had very little accuracy in correctly detecting if the patient had the disease. For calculation 4, there was over a little over 50% (63.2%) chance that there will be a negative final test conclusion given that the patient will not develop the disease and about 80% (81.7%) probability that a patient will not develop a disease given a negative final test conclusion, demonstrating that correctly diagnosing a patient with the disease has an average chance of success. Calculation 4 had better results than calculation 3 in detecting patients without the disease and giving the correct diagnosis. Calculation 3: What is the probability that a patient will develop the disease, given a positive final test conclusion? Calculation 4: What is the probability that a patient will not develop the disease, given a negative final test conclusion? Some possibile sources of human error are groups not inputting any data into the final spreadsheet and if any groups had inaccurate data, thus skewing the results of the Bayes values. Intro to Computer-Aided DesignTinkerCAD Our Design These images show our design for a modified fluorimeter from an aerial and frontal perspective omitting the cover and flap on the front. The camera is mounted into the rear wall in a fixed position level to the slide. The slide is mounted on rails for adjusting distance from the lens. The camera allows for stable bursts of images that can be loaded directly onto the computer and ideally the image J software from the device using a USB cable.
Feature 1: ConsumablesPCR Consumables Kit:
We will keep consumables the same. We believe the strength within consumables is their ease of use (we as freshmen were able to quickly learn and use them). Too, they are cost efficient.
Feature 2: Hardware - PCR Machine & FluorimeterOpenPCR:
Fluorimeter system:
| |||||||


