BME100 f2015:Group2 8amL2
| Home People Lab Write-Up 1 | Lab Write-Up 2 | Lab Write-Up 3 Lab Write-Up 4 | Lab Write-Up 5 | Lab Write-Up 6 Course Logistics For Instructors Photos Wiki Editing Help | |||||||
|
OUR TEAM
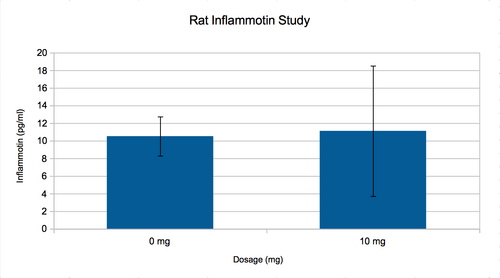
LAB 2 WRITE-UPDescriptive StatisticsExperiment 1 (Human Study) Experiment 2 (Rat Study) With the previous means, the standard deviation and standard error were able to be calculated: at 0 mg, the standard deviation is 2.226 and the standard error is 4.703. at 10 mg, the standard deviation is 7.403 and the standard error is 3.311.
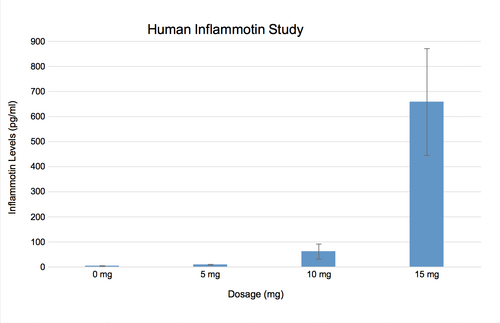
ResultsExperiment 1 (Human Study)
Experiment 2 (Rat Study)
AnalysisIn the above image, the p-value can be obtained from the ANOVA test. The p-value is less than .05, therefore there is statistical difference between the groups.
Since there are only 2 data sets for the rat study, the t-test was used.The p-value was found to be 0.8674035, which is greater than 0.05. Therefore,there is not any significance between the data sets.
Summary/DiscussFrom the study, you can see that the LPS has an effect on both the human subjects and the rat subjects. However, the inflammotin levels were different between the varied between the two groups. Even though the LPS did increase the amount of inflammotin in the rat subjects, the inflammotin increase was not very significant. In the human subjects, as the LPS increased, so did the inflammotin levels, and significantly too. Through our analysis of the information, we can conclude that LPS does increase inflammotin in humans. The more LPS present, the inflammotin is drastically increased. In rats, an increase in the amount of LPS only increases the amount of inflammotin very slightly. |
|||||||


