BME100 f2015:Group1 8amL2
| Home People Lab Write-Up 1 | Lab Write-Up 2 | Lab Write-Up 3 Lab Write-Up 4 | Lab Write-Up 5 | Lab Write-Up 6 Course Logistics For Instructors Photos Wiki Editing Help | ||||||||||||||||||||||||||||||||||||||||||||||||||||||||||||||||||||||||||||||||||||||||||||||||||||||||||
|
OUR TEAM
LAB 2 WRITE-UPDescriptive StatisticsExperiment 1
ResultsExperiment 1 Experiment 2
AnalysisExperiment 1
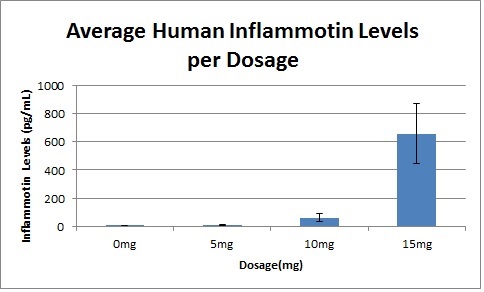
There is an observable difference between levels of Inflammotin levels for each dosage in comparison to each other, since the p value for the comparisons is less than .05. The use of ANOVA is needed because we are investigating variance between several groups.
Experiment 2
There is no significant difference between the 2 groups of rats, 0mg and 10mg, because the p value is .86, which is higher than .05. The T-test was needed because it was comparing 2 groups.
Summary/DiscussionThe data of the experiment has a purpose of showing the effects of lipopolysaccharide in 2 different species, rats and humans. The data showed that there was no statistically significant effects on rats, however there was a significant effect on humans. Because there were 2 sample groups of rats, a t-test was needed for the experiment. This showed a p value of .867 for rats, showing that the effect on inflammation concentration in rats was minimal. An ANOVA test was used to compare the several groups of human samples. The p-value for the ANOVA test was 1.40083E-16. Because that number is less than .05, there is a statistically significant difference in the data for humans. All of the data sets were significantly different from each other. Some reasons why the effectiveness results varied between species may be because: the number of samples in each group, the dosage difference in each test, and many other possibilities. |
||||||||||||||||||||||||||||||||||||||||||||||||||||||||||||||||||||||||||||||||||||||||||||||||||||||||||


