BME100 f2015:Group17 1030amL2
| Home People Lab Write-Up 1 | Lab Write-Up 2 | Lab Write-Up 3 Lab Write-Up 4 | Lab Write-Up 5 | Lab Write-Up 6 Course Logistics For Instructors Photos Wiki Editing Help | |||||||
|
OUR TEAM
LAB 2 WRITE-UPDescriptive StatisticsExperiment 1 Human Standard Deviations: 0mg= 1.523 5mg= 1.594 10mg= 30.11 15mg= 212.9 Human Standard Errors: 0mg= .4816 5mg= .5040 10mg= 9.522 15mg= 67.34 Experiment 2 Rat Standard Deviations: 0mg= 2.226 10mg= 7.403 Rat Standard Errors: 0mg= .9953 10mg= 3.310
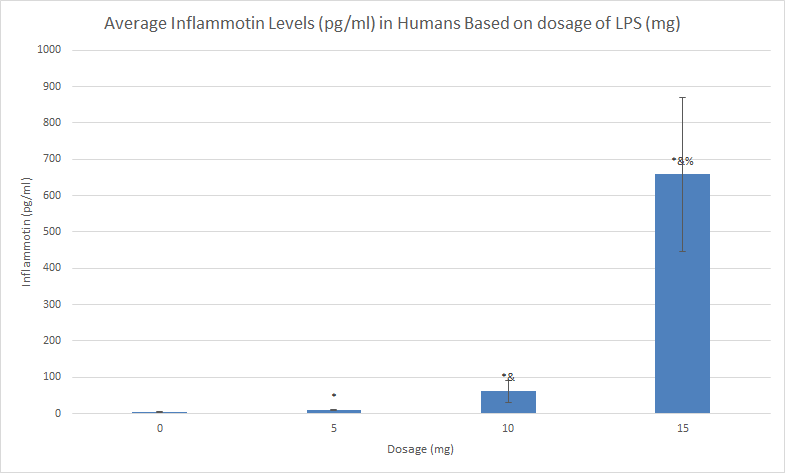
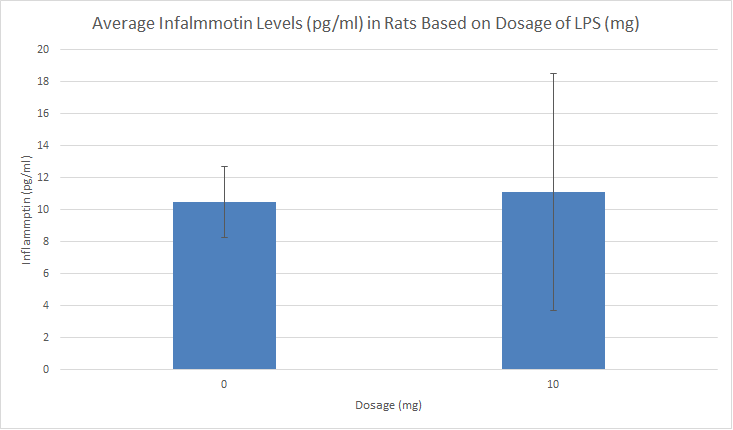
ResultsLegend: *(significant to 0), &(significant to 5), %(significant to 10) Error bars based on standard deviation Error bars are based on standard deviation
AnalysisExperiment 1
.8674035
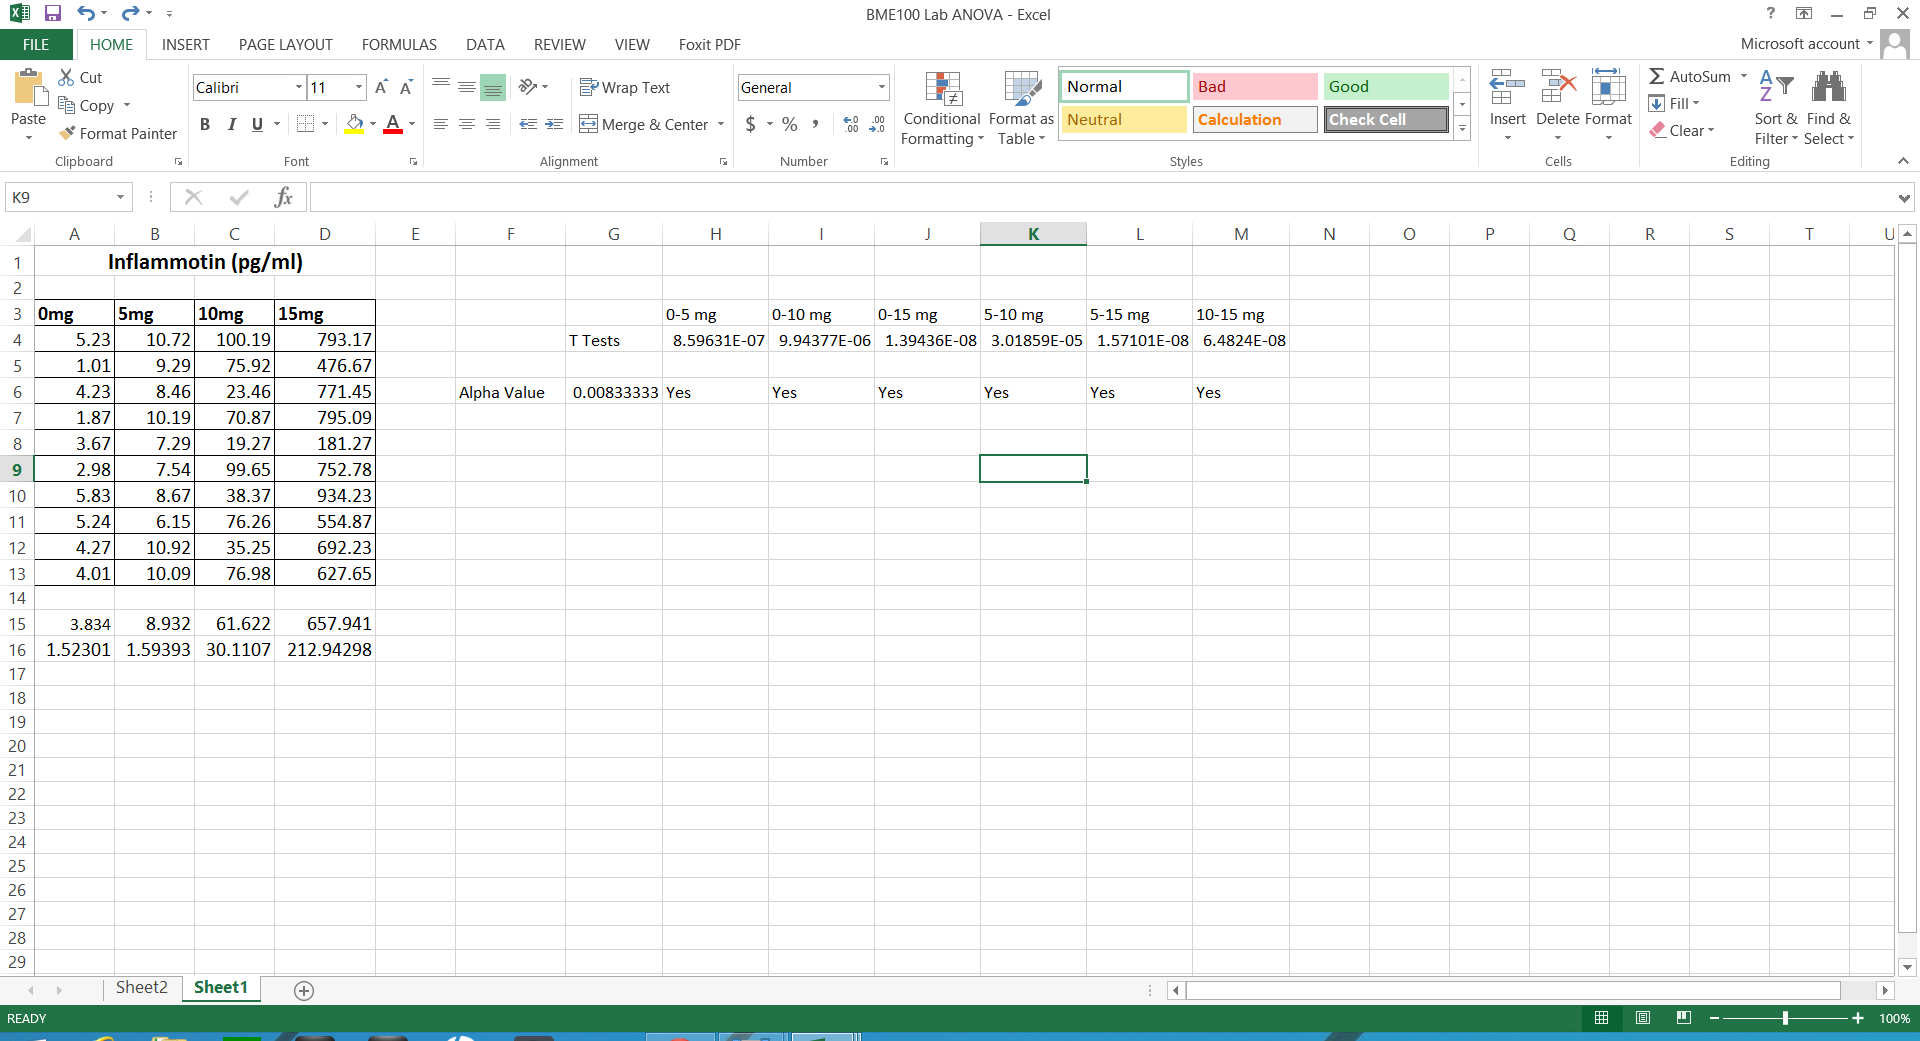
Summary/DiscussionEach data set involved different tests of inferential statistics in order to determine the statistical difference. In the study on humans, the average inflammation levels per dosage are as follows: 0mg=3.834pg/ml (Standard Deviation-1.523; Standard Error-0.482), 5mg=8.932pg/ml (SD-1.594; SE-.504), 10mg=61.622pg/ml (SD-30.11; SE-9.522), and 15mg=657.941pg/ml (SD-212.9; SE-67.34). In the rat study, the average inflammation levels per dosage are as follows: 0mg=10.516pg/ml(SD-2.226; SE-.0.995), and 10mg=11.112pg/ml(SD-7.403; SE-.3.311). For the rat results, a T-test was used because it compares two sets of data and there were only two averages in the data set. There is no statistical difference in this data because the p-value (.87) is greater than .05. If the p-value was less than .05, then there would be at least 95% confidence that there was statistical difference. However, there is only about 13% confidence. The ANOVA test investigates differences among several groups of data, so this was implemented in the human results. There is a statistical difference between data sets because the p-value of the ANOVA test is 1.4e-16. There is nearly 100% confidence that the data is statistically different. Included with the ANOVA test was a post-test to determine if each comparison is statistically different. The Bonferroni Correction is .0083 and all of the t-test values are less than this number, so the data is statistically significant. While there was no statistical difference of the average inflammation levels of rats, there is a very clear statistical difference in humans. In the humans, as the dosage of LPS increased, the inflammation levels also increased. Kristen believed that the rats would also follow this correlation, and the increase in the average level of inflammation might be proof. However, it cannot be used to prove anything because there is not nearly enough confidence that the same results will occur again. |
|||||||


