BME100 f2015:Group15 8amL6
| Home People Lab Write-Up 1 | Lab Write-Up 2 | Lab Write-Up 3 Lab Write-Up 4 | Lab Write-Up 5 | Lab Write-Up 6 Course Logistics For Instructors Photos Wiki Editing Help | |||||||
|
OUR COMPANY
LAB 6 WRITE-UPBayesian StatisticsOverview of the Original Diagnosis System Each of the 17 Groups were given a positive control, which is DNA from a person who tested positive for the disease SNP, a negative control, DNA from a person who does not carry the disease SNP, and two random samples of DNA from patients who have never been tested for the disease SNP. Each group, consisting of five or six students, set up PCR reactions and ran three trials, or replicates, for each patient. Each group had to identify whether the patients they were assigned were positive or negative for the SNP using PCR and ImageJ to collect data and make a conclusion. The results from all 17 groups were eventually collected on a master chart for statistical analysis. Each group was told to be careful to not mix up or mislabel their samples, for then it would be possible to misdiagnose a patient, and were also told to make sure to document everything carefully and to not lose any information. Each group had to be very precise with the volumes for the PCR reactions. A common mistake is ending up with too much volume in the tubes, this is caused by pushing the plunger of the micropipette to the second stop, then drawing up liquid, instead of stopping at the first stop, then drawing up liquid. Each group had to also be careful to not cross-contaminate the samples by re-using the tips of the micropipette. When the groups used a popular dye known as SYBR Green I, each group was told they must wear gloves while handling any liquid containing SYBR Green I. Each team used a prepared solution of SYBR Green that when placed on a slide coated to repel water, and using a simple Fluorimeter will give a visual color signal when dsDNA is present that can then be quantified by taking an image with a Smart Phone. In order to obtain good data analysis, each group had to have three independent images at each DNA concentration, including the zero DNA concentration solution, in order to generate a good dot plot. After taking all of the pictures, each group then used ImageJ to analyze the images to find the area, integrated density, standard deviation, and mean grey value. After analyzing the images, the groups were then able to indicate, through how much SYBR Green I was present, whether the patients they were assigned were positive or negative for the SNP. High concentrations of SYBR Green I showed that the patient was positive for the disease and low concentrations showed they were negative for the disease. When the results from all 17 groups were collected on a master chart for statistical analysis, it provided the total number of patients that were positive and negative for the SNP. Three groups did not provide any test result.
Based off calculations 3 and 4, the values are not close to 100%, the reliability of the diagnostic approach can be both reliable and unreliable. Therefore, the results can be either true or untrue.
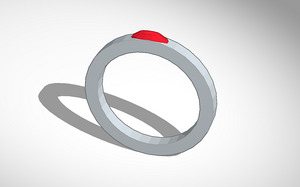
Some human error includes not mixing the correct amounts of each solution and DNA properly. Another error could have been placing the camera at non consistent distances. Machine error includes not being able to change the settings of the camera to fit our needs as well as it not focusing properly so that imagej could analyze it properly. Not keeping a detailed record of numbers also mixed up results. Intro to Computer-Aided DesignTinkerCAD TinkerCAD is a website where you can design and create 3D objects for 3D printing or prototyping. In the Computer-Aided Design Lab we used TinkerCAD to create a ring that connects to any smart-phone or device with bluetooth, and it allows you take pictures by clicking the button on the ring. Using the TinkerCAD website we watched tutorials on how to design a ring and apply it to our final design. In the end we designed a silver ring with a red button on top as our final design.
As the final design we created a ring with a small button on top. We choose this design because it was simple and it’s effective. In the PCR lab it was difficult to take pictures and close the flap of the box to block out the light really fast. The idea of this design is so you can leave your phone in the box in the PCR lab and just press the button on your ring at any time to take pictures.
Feature 1: ConsumablesOur team decided to keep the original packaging of the consumables. Therefore, there will be small plastic test tubes, a micropipettor, and a box with clean micropipettor tips.
Feature 2: Hardware - PCR Machine & FluorimeterFluorimeter and the PCR machine are essential instruments to be used in laboratories for DNA duplication. Our group decided to use the same process, but with an additional step between transferring the DNA from the PCR machine and the fluorimeter. In order to make sure the DNA duplicated accurately, a camera feature will be included in the newly designed machine. This extra step will allow the results to be more accurate. The design of the fluorimeter was not changed. Therefore, this process will remain the same.
| |||||||


