BME100 f2015:Group15 8amL2
 BME 100 Fall 2015 BME 100 Fall 2015
|
Home People Lab Write-Up 1 | Lab Write-Up 2 | Lab Write-Up 3 Lab Write-Up 4 | Lab Write-Up 5 | Lab Write-Up 6 Course Logistics For Instructors Photos Wiki Editing Help | ||||||
|
OUR TEAM
LAB 2 WRITE-UPDescriptive StatisticsExperiment 2
ResultsExperiment 1
AnalysisExperiment 1
Experiment 2
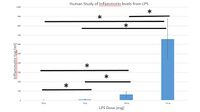
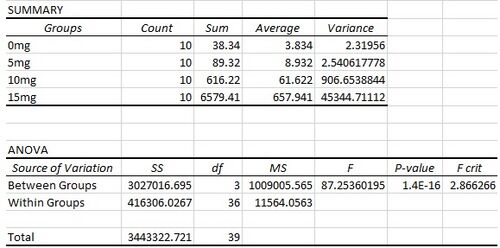
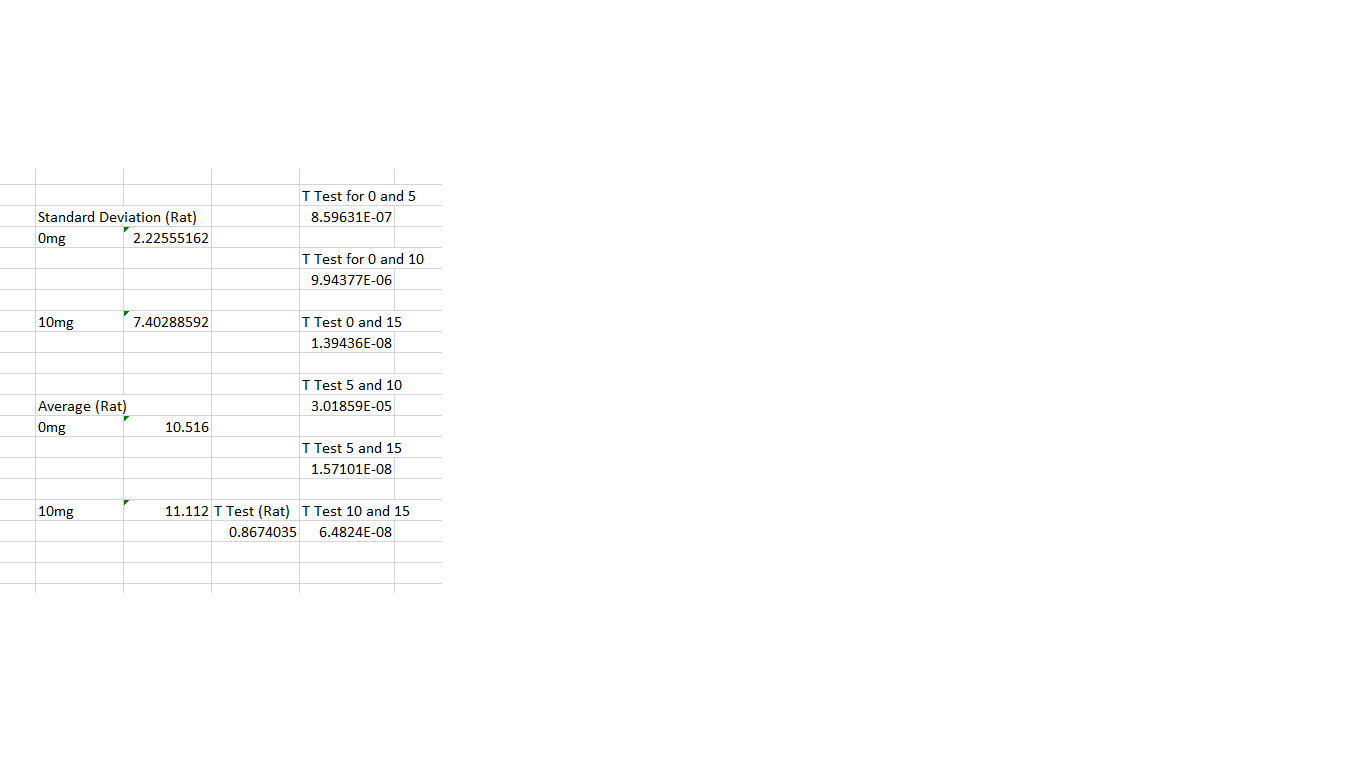
Summary/DiscussionBased on the results of the experiment, once the descriptive statistics were analyzed on both the data sets of the rats and the humans, the experiment was proven successful. The reason for this was because when the dosage of the LPS increased the infammontin levels increased. 0 mg was the control in the experiment. At 5 mg there is a small increase in the inflammotin levels but not enough to warrant a significant amount. At 10 mg there is a significant increase in the inflammotin levels much larger than the first increase. At 15 mg there is a very large increase in the inflammotin levels which indicates that in between 10 and 15 mg there is a particular amount of LPS that will produce enough inflammotin for any application. |
|||||||


