BME100 f2015:Group15 1030amL2
From OpenWetWare
Jump to navigationJump to search
| Home People Lab Write-Up 1 | Lab Write-Up 2 | Lab Write-Up 3 Lab Write-Up 4 | Lab Write-Up 5 | Lab Write-Up 6 Course Logistics For Instructors Photos Wiki Editing Help | |||||||
|
OUR TEAM
LAB 2 WRITE-UPDescriptive StatisticsHuman trials Standard Deviation Count Standard Error Median
Averages 0 milligrams: 10.516 Standard Deviations 0 milligrams: 2.225551617 (units?) Standard Errors 0 milligrams: 0.99529694 (units?)
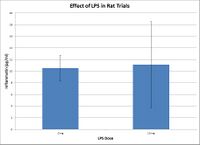
ResultsExperiment 1
Note: Error bars use standard deviation of data in this data set.
Experiment 2 Human Trials AnalysisExperiment 1 As seen in the data graphed above, as the dosage of LPS was increased from 0mg, 5mg, 10mg, and 15mg, the inflammotin levels in the blood of the rat rose consistently. When the data was put through an ANOVA test all of the data was found to be significant.
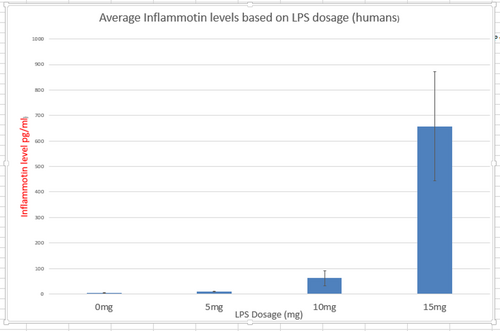
Experiment 2 When different groups of human subjects were given 0mg, 5mg, 10mg, and 15mg of LPS, the levels of inflammotin were then recorded. When this data was graphed it could be seen that as the dosage of LPS was raised, the inflammotin levels in the subjects rose as well. Before being graphed, the data was put through an ANOVA test and all of the data was found to be significant. The demonstrated error bars can be seen on the bar graph above and were calculated from the standard deviation of the data.
Summary/DiscussionTo answer the question of how LPS dosages affect inflammotin levels in the body, groups of rat and human test subjects were chosen by strict criteria so as to prevent sample bias as much as possible. Each dosage of LPS, 0mg, 5mg, 10mg, and 15mg, were each given to a different group of subjects. The inflammotin levels were then recorded and the data clearly shows that in both the rat and human test subjects, as the dosage of LPS was increased, the levels of inflammotin in the subjects increased. Both sets of data were put through ANOVA tests because the data was dealing with more than two test groups, and all of the data was found to be significant. |
|||||||


