BME100 f2015:Group13 1030amL2
| Home People Lab Write-Up 1 | Lab Write-Up 2 | Lab Write-Up 3 Lab Write-Up 4 | Lab Write-Up 5 | Lab Write-Up 6 Course Logistics For Instructors Photos Wiki Editing Help | |||||||||||||||||||||||||||||||||||||||||||||||||||||||||||||||||||||||||
|
OUR TEAM
LAB 2 WRITE-UPDescriptive StatisticsRat Study
ResultsRat Study Human Study
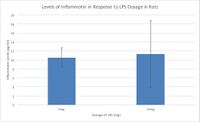
AnalysisRat Study We used the t-test to analyze the data from the rats because the rats were divided into two groups, 0mg and 10 mg doses of LPS. The t-test is a statistical test used to investigate differences between two groups. In addition, the t-test was unpaired because the two rat groups were made up of different rats.
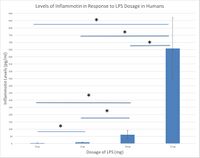
Human Study We used the ANOVA to analyze the data from the human study because that study utilized four groups, and the ANOVA is used to analyze differences between more than two groups. After the ANOVA test indicated that there could be a statistically significant difference between the groups, we carried out a post-hoc test to confirm that the differences were actually statistically significant.
Summary/DiscussionIn the human study, administering LPS doses to the subjects was shown to increase Inflammotin protein levels by a statistically significant amount. With a 0 mg LPS dose, Inflammotin levels were at an average of 3.834 pg/ml. This rose to 8.932 pg/ml with a 5 mg dose, 61.622 with a 10 mg dose, and 657.941 pg/ml with a 15 mg dose of LPS. We can conclude with greater than 95% confidence that the LPS increases Inflammotin levels in elderly humans. In the rat study, however, there was no statistically significant difference between Inflammotin levels between rats given a 0mg dose of LPS and a 10 mg dose. Rats given 0 mg of LPS had an average Inflammotin level of 10.516 pg/ml while rats given a 10 mg dose had an average level of 11.112 pg/ml. We cannot conclude that LPS has an effect on Inflammotin levels in rats from the data provided. Both studies were designed to determine whether LPS had an effect on Inflammotin protein levels. The human study, however, was much better constructed. A greater range of LPS doses were tested on humans, and each test group was a larger size in comparison to the rat study. This increased the reliability of the results obtained from the human study and we were able to draw a clear conclusion after analyzing the study's data. From the much smaller amount of data in the rat study, we were not able to confirm or deny the idea that LPS has an effect on Inflammotin levels. |
|||||||||||||||||||||||||||||||||||||||||||||||||||||||||||||||||||||||||


