BME100 f2015:Group12 8amL6
| Home People Lab Write-Up 1 | Lab Write-Up 2 | Lab Write-Up 3 Lab Write-Up 4 | Lab Write-Up 5 | Lab Write-Up 6 Course Logistics For Instructors Photos Wiki Editing Help | |||||||
|
OUR COMPANY
LAB 6 WRITE-UPBayesian StatisticsOverview of the Original Diagnosis System In our class we took a total of 34 patients and divided them up equally between 17 lab groups of 6 students so each group had a total of two patients. Each group was asked to use the PCR machine and take pictures with a smart phone of the drops and then upload them and analyze them through the image j program. To prevent error each group took 3-4 pictures of the drop to ensure accuracy in their calculations. In Image J when we would use the selection tool to select the drop we would copy that selection into the selection manager to ensure we are selecting the same area and size of the drop. Another way we prevented error was by using a new sterile micropipette tip to collect the samples and put them on the PCR Machine disposing of the previously used tip every time. A challenge that was presented when doing this lab was when we tried to use an iPhone the flash would go off when we were using the timer setting and we wouldn’t want to use to flash because that would cause problems in the images making them more difficult to read. A way that an error was possibly presented was when we would go in to take a new photo it is possible that the camera could have shifted to a different position and distance than the one that we previously noted.
In the Bayes Statistics, the result of calculation 1 and 2 represent the probability that if a patient will get a positive or negative PCR reaction. For both calculation 1 and 2, the values are very close to 1 which also means 100%. We can know that the experiment is reliable from these high Bayes values. There are lots of small mistakes can change the values such as the light in the fluorimeter. And also, the small mistakes of using image J also can lead to a wrong calculation.
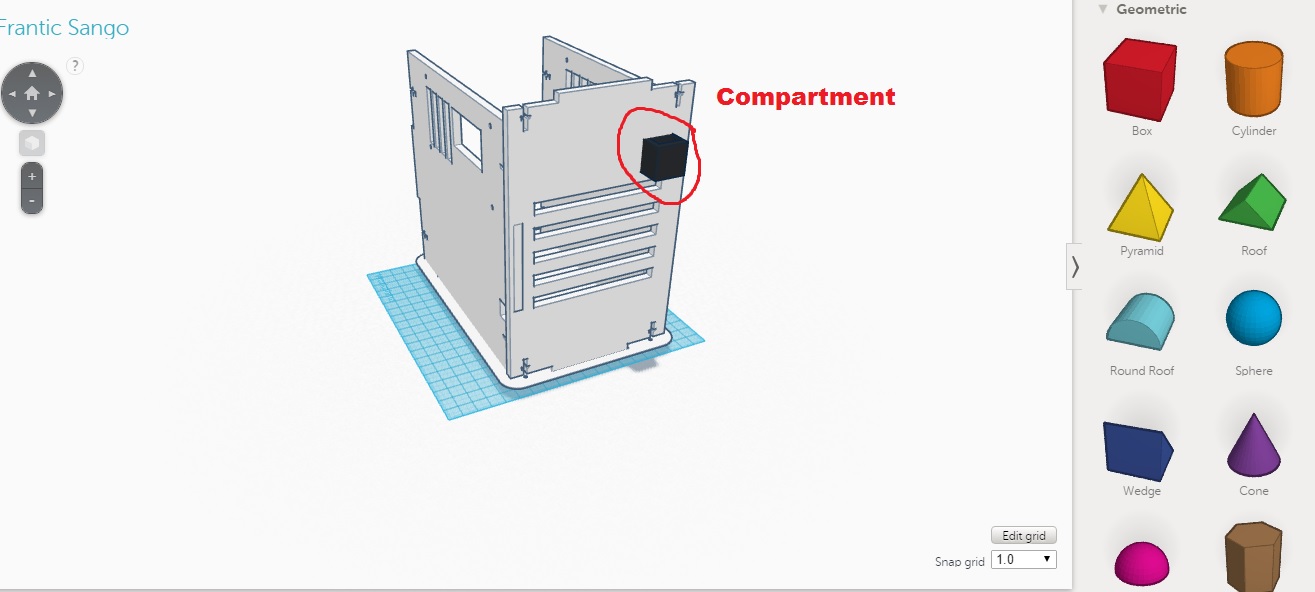
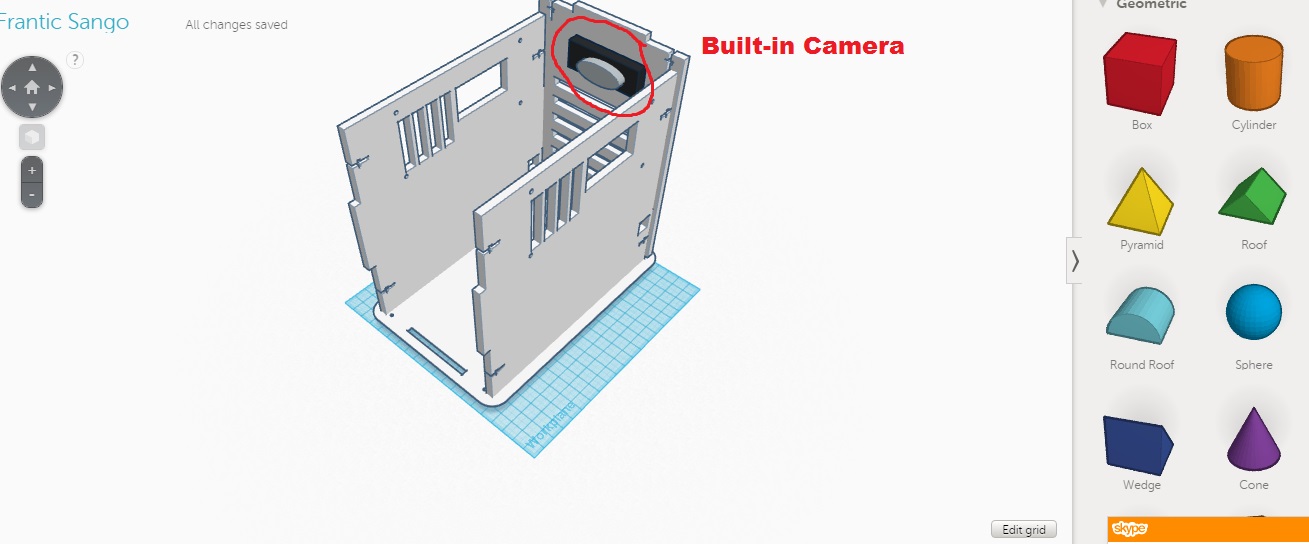
Sources of Error Intro to Computer-Aided DesignTinkerCAD First, the necessary parts were imported into TinkerCAD. The URL was copied into the import section of TinkerCAD, thus resulting in the two example bodies being developed. The two parts were then placed in their respective positions, based on the image provided, using the drag tool. Then, the two side panels were imported. This would act as the skeletal basis of the built in camera, which will be explained later. Then, a cube shape was created. The cube was then dragged, and moved upwards. It was then attached to the front body. Then, a 2nd cube shape was placed on the top of first cube. The second cube was then designated as a hole, and the two cubes were grouped. This resulted in a open box structure, acting as the compartment for the DNA to be placed in. For the built in camera, a rectangle box shape was dragged into the inside of the box. It was placed in the front-body wall. Then a cylinder was attached to the front surface of the rectangle box. This serves as the lens. The cylinder was then widened, and its length was decreased so it appears as a flat oval. This flat oval was then attached to the square box, thus acting as the lens. Our Design
Feature 1: Consumables
The consumable that will be packaged in our kit are the slides that are placed in the fluorometer. This is because we want to redesign the slide specifically for our device to make more user friendly. We would also like to change the color of our slide. Instead of having the clear glass slide we used in lab that can refract light and affect the image, we want a slide that is dark in color (black) so it absorbs the light from the fluorimeter. We also want to create small, shallow crevasses on the top of the slide so its easy to put the fluid exactly where it needs to be. The machine will also have a "lock in" feature that locks the slide in at the perfect spot for the beam to shit through it, maximizing accuracy and consistency. These slides will be very small and thin and each one will be disposable so you don't have to remove the fluid from the slide before you put a new sample on. With our slide you test your sample, dispose of the slide when finished then start fresh with a new one each time.
Feature 2: Hardware - PCR Machine & Fluorimeter
Some major weaknesses in the PCR machine are the sensitivity of the machine, the complexity of the assay, and the price for the equipment. We found that the biggest issue was the sensitivity of the product. The sensitivity of the device had many negative side affects. For example, any form or amount of contamination to a PCR sample could contribute to misleading results. Another issue with this is that the PCR machine cannot tell the difference between like samples. For example, it cannot differentiate between live or dead organisms, it cannot differentiate between vaccine strains and wild type pathogens, and it cannot differentiate between incidental presence of an organism, colonization without disease, transient infection, or active infection with disease. Because of the severity of these drawbacks, we decided to address this problem in hopes of creating a PCR machine that would give more accurate results and that would be able to differentiate between live or dead organisms, vaccines or wild type pathogens, and contaminated samples or active infections diseases. For our new, and improved, PCR machine, we decided to add a separate compartment that would essential hold an "ideal sample." This sample would contain the minimum concentration needed to result in a conclusive test. So if a testing sample was introduced and was contaminated (by a small amount) the results would be inconclusive since the concentration of the contamination the the PCR sample is less than our ideal sample. This ideal sample would also contain the exact data sequence as we wish to find in our testing sample, and would not accept any sequence similar too it, only an identical sequence.
When operating the Fluorimeter in lab, our group had several difficulties. For one, it was difficult handling all the various equipment outside of the fluorimeter. There was a blackout box, a phone (to take pictures), a stand to prop up the phone. Another problem was having to carefully take off the black out box each time making sure to not move any of the other components. Then there was the the problem with the phone, trying to get it at the perfect angle was nearly impossible. Then having to get those pictures onto the computer with the phone and trying to make sure you got the order perfect - it was exhausting. For this reason, we decided to make an all in one solution. Out solution would create a simple, easy to use, all in one device that would solve all these problems. Our device would have a build in blackout box that would surround the entire fluorometer. It would have an easy access top door to access the machine and place the slides in the machine. Our machine would also have a a built in camera on the front that is already adjusted to the percent angle need to take the best pictures. The camera would be able to be adjusted closer or farther away if needed with a printed ruler on the side to easily measure the distance and ensure consistency. A button would be conveniently located on the side of the box to take the picture when the user is ready. And finally, there would be a USB cord that connects to a computer to upload all the photos immediately after the the picture was taken.
| |||||||


