BME100 f2015:Group10 1030amL5
| Home People Lab Write-Up 1 | Lab Write-Up 2 | Lab Write-Up 3 Lab Write-Up 4 | Lab Write-Up 5 | Lab Write-Up 6 Course Logistics For Instructors Photos Wiki Editing Help | ||||||
OUR TEAM
LAB 5 WRITE-UPPCR Reaction ReportOur team conducted the procedure of pipetting the way it was described in the pre-lab readings and watching video modules helped with getting familiar on how to use a pipette. Each team member understood the difference between the first and second stop on the pipettor. The first stop on the pipettor is used to collect a sample once finger has been removed from stop and sample has been collected. The second stop is used to release all of the sample from the pipettor into the desired location. The final reactions had the same amount of liquids for all tubes because the pipettor was calibrated to intake a volume of 120 micro-liters. Sample of DNA and PCR reaction mix were left over because the procedure was focused on taking a specific amount of sample for PCR reaction. Prior labeling of tubes from previous investigation worked efficiently for labeling tubes and avoiding cross contamination for this investigation. Pipetting was done successfully in the group by following the pre-lab reading steps and instructions on day of the lab. Fluorimeter ProcedureBrandon:
Smart Phone Camera Settings
7 IF THIS FOLLOWING PORTION IS BLANK PLEASE GIVE BRANDON A "0%" FOR CONTRIBUTION
Data Collection and AnalysisThe images for the high, low, and zero Calf Thymus DNA were deleted and misplaced.
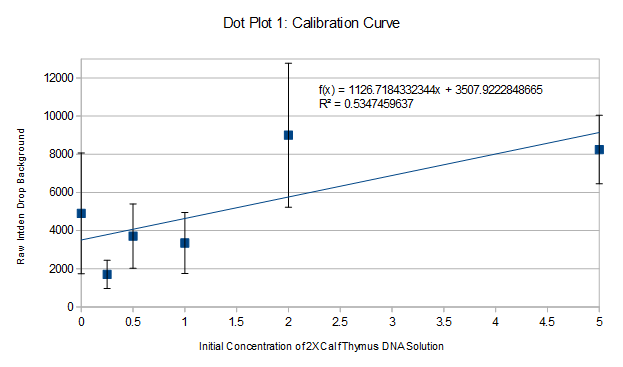
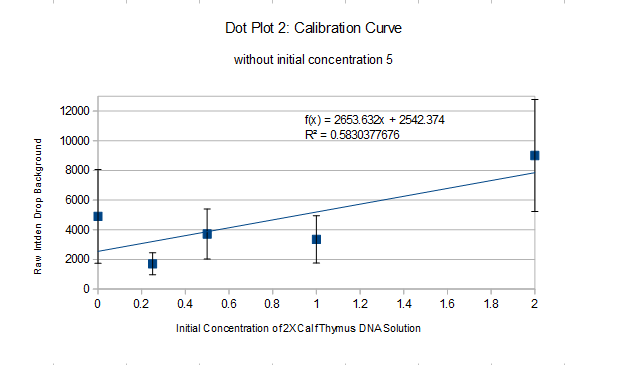
PCR Results: PCR concentrations solved
PCR Results: Summary 527991 = 2653.632x+2542.374, x=198.011
1-1: 177.01 1-2: 204.93 1-3: 174.42 Mean: 185.45
2-1: 41.308 2-2: 42.067 2-3: 55.749 Mean: 45.04
Patient 27800 has a mean concentration of 185.45 ug/mL, a mere 8 ug/mL away from the positive control, indicating that the patient contains the mutation indicated by the PCR test.
Patient 35993 has a mean concentration of 45.04, below the threshold for the negative control, indicating that the patient does not contain the mutation indicated by the PCR test.
| ||||||


