BME100 f2014:Group29 L3
Our Team
 |
 |
 |
 |
 |
 |
LAB 3A WRITE-UP
Introduction
The purpose of this test was to evaluate a device called the Spree band. The producers of the Spree band claim that this band can accurately measure heart rate and body temperature.
To test the validity of this device, a Spree band was placed on a test subject along with gold standard heart rate and temperature monitors. The subject went through a ten minute warm up exercise, sixty minutes of physical activity, and then a ten minute cool-down. During the warm-up, the subject was not participating in any physical activity and was inside a building. Every two minutes the heart rate and temperature of the subject was recorded from the Spree band as well as the gold standard devices. After the ten minute warm-up was complete, the subject was instructed to start walking outside with the spree band and gold standard devices still on. Every five minutes measurements were recorded from all devices. When the sixty minutes of physical activity was complete, an indoor cool-down was conducted. Every two minutes, just like the warm-up, measurements were recorded from the gold standard and Spree devices.
After the trial was finished, the recordings were inputted into an excel sheet and analyzed through a t-test.
Descriptive Statistics
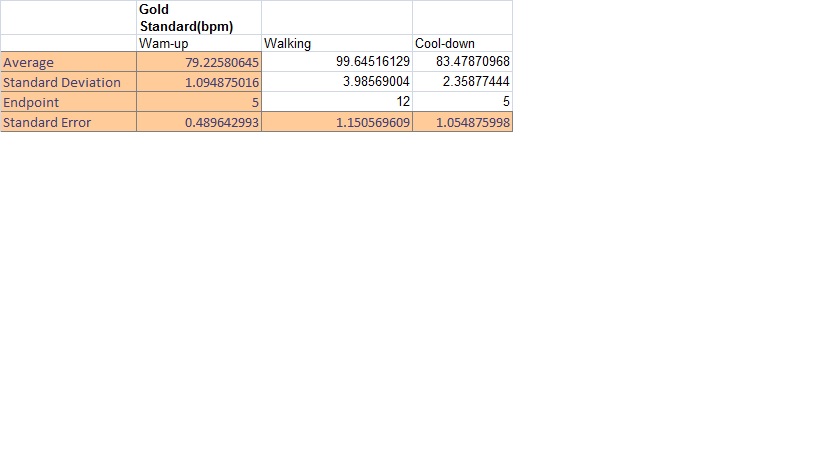
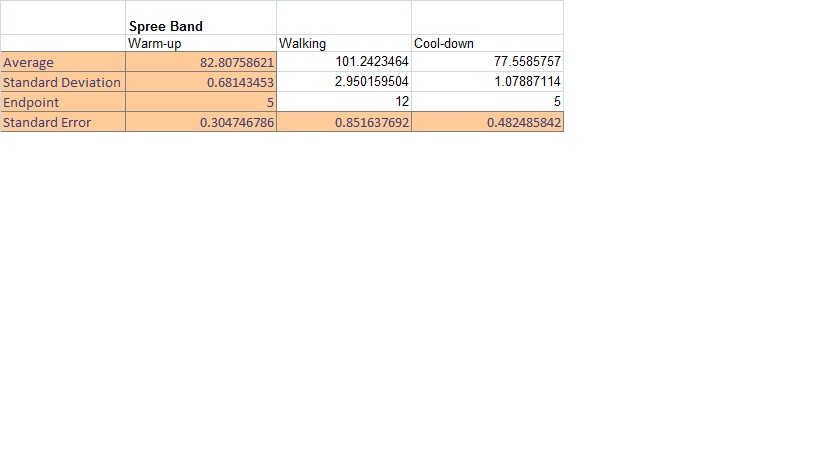
Heart Rate:
All heart rate measurements were measured in bpm.
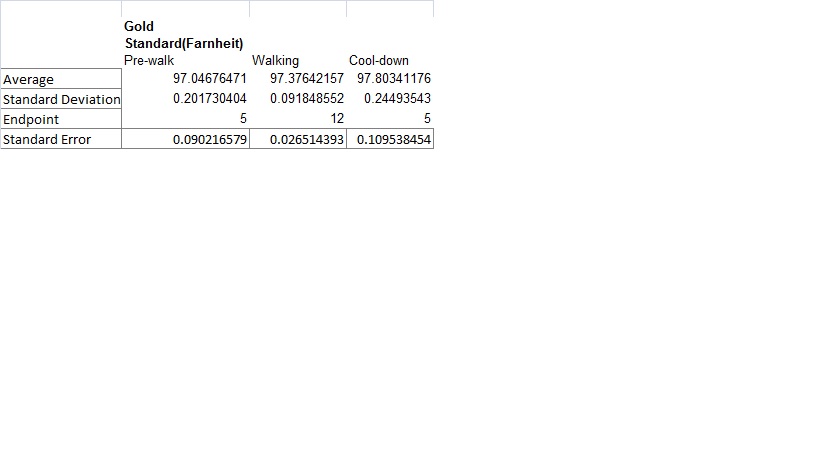
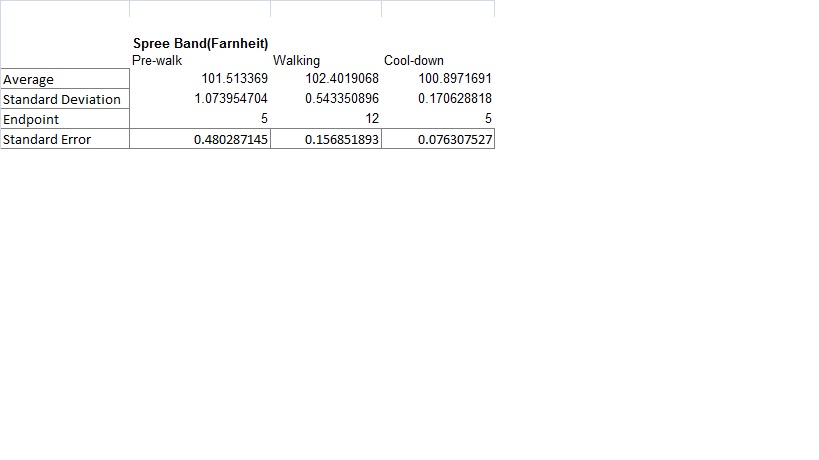
Temperature:
All temperature measurements had units of Fahrenheit.
Inferential Statistics
Graphs
Results
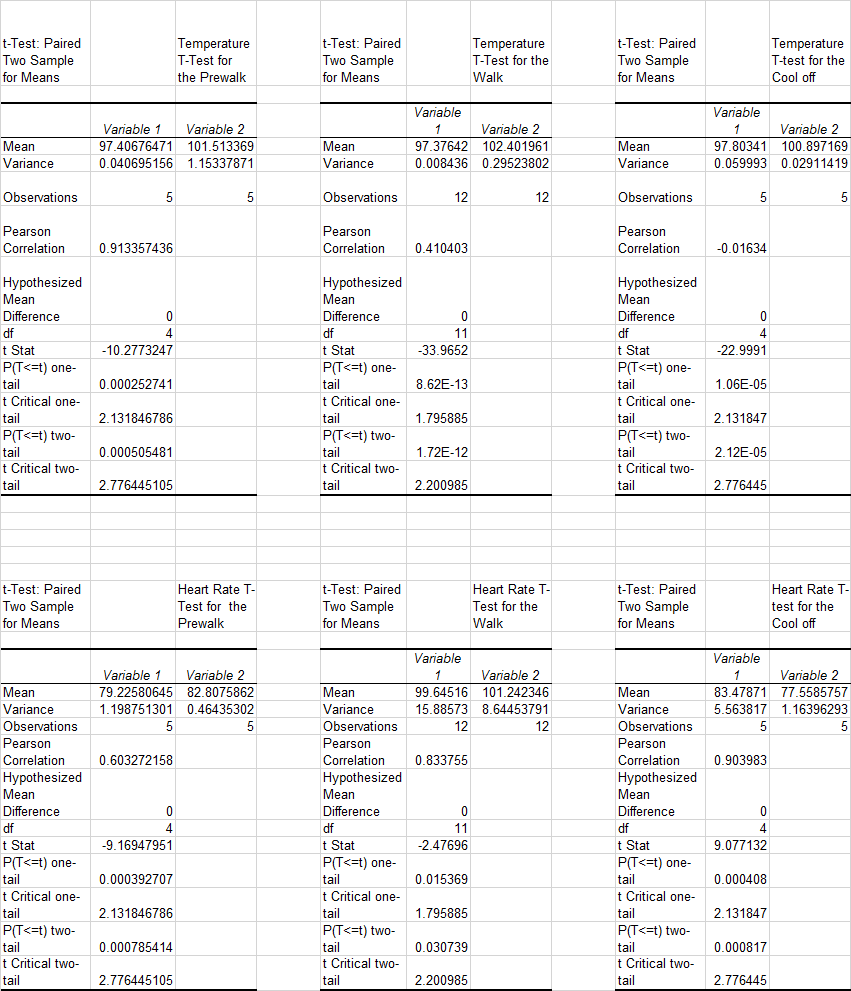
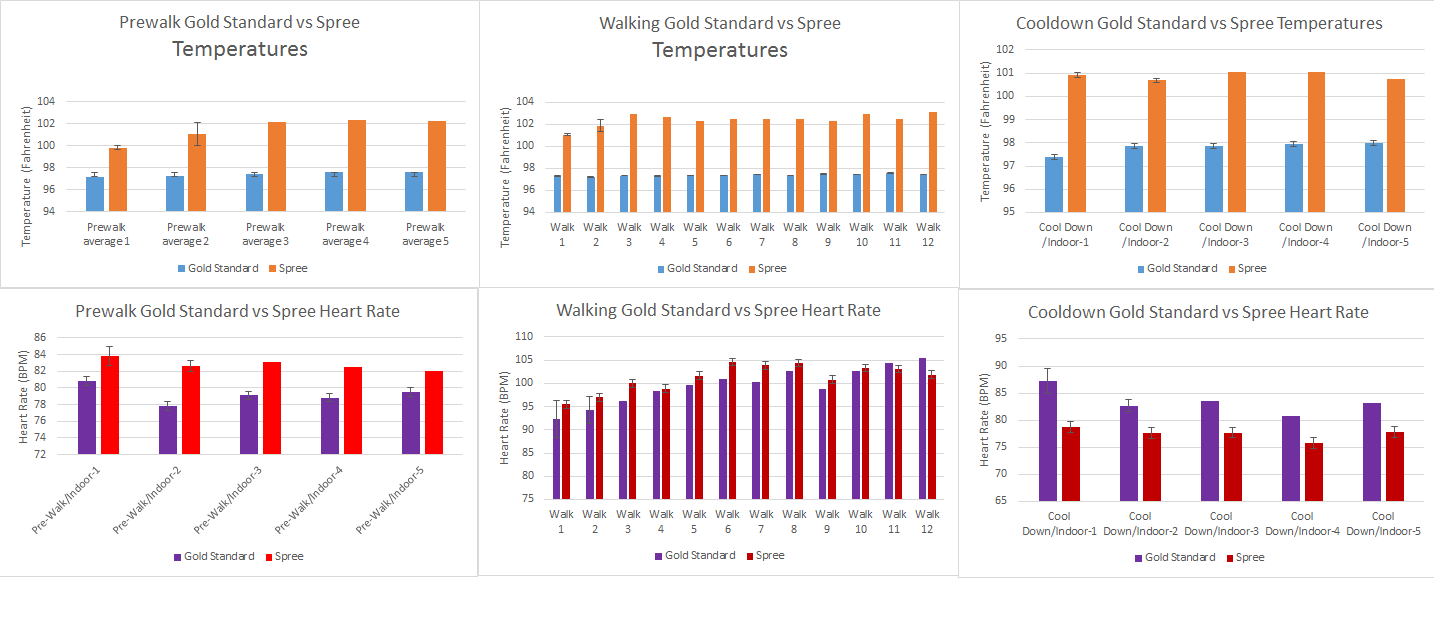
T-tests were ran to compare the data of the warm-up, walking and cool-down for both the heart rate and temperature. The data found from the gold standard device was compared to the data found from the Spree band. When analyzing a t-test for an experiment like this, a p-value that is close to .95 is what is desired. A result similar to that would show that the two sets of data are not statistically different. Having the sets of data coming out to be similar is good when testing a product against the gold standard, so a higher p-value means that the product being tested is achieving results close to that of the gold standard, which is what the company is aiming for. The p-values that came out of the data collected were fairly low, showing that the Spree band did have a statistical difference with the gold standard, this is the exact opposite result desired. By testing the product against the gold standard, the null hypothesis that there is a statistical difference between the collected from the Spree band and the gold standard was unable to be disprovd with low p-values. This essentially means that the product is not very good in that it provides readings that differ significantly from the gold standard.
Changes Made To Raw Data
The Spree Band measures temperature in whole number integers from 1-4. To start, the temperature measurements for the Spree band were changed as follows:all of the 1's were changed to 97° F, all of the 2's to 103°F, all of the 3's to 110°F, and all of the 4's were changed to 116°F. This change to the raw data collected allowed there to be an effective T-test because the Spree Band measurements needed to be in degrees Fahrenheit just like the temperature measured with the gold standard, a thermometer. Also, a change needed to be made to some of the gold standard measurements that were in degrees Celsius because everything needed to be measured in Fahrenheit to be accurate. Any data that was clearly wrong and had error due to various circumstances such as heart rates that were so low, the person should have been dead, or problems between the Spree band connection and the app. After all of these changes were made, the data from each group could be analyzed. The sections of data were divided into: resting, exercising, and cool down. Each section was had an area for gold standard measurements and Spree Band measurements so that when the T-test was ran, all of the data was organized and divided so it was easier to run the tests, and interpret the results.
To find mean and standard deviation, the averages for the gold standard measurement of groups 1-17 and groups 18-34 were taken and those two points were then averaged to find the mean of the data as a whole. This same procedure was done for the Spree measurements. Standard deviation was found by taking the standard deviation of groups 1-17 and the standard deviation of groups 18-34 and the average of those two points was taken to yield the standard deviation for all data. All of these steps were then repeated for heart rate.
Experimental Errors
The main errors that existed were with the Spree Band. The Spree Band would often disconnect from the phone's app so that data could not be recorded at some points, yielding inconsistency in the data. Also, the Spree Band would sometimes say the heart rate was bellow 20bpm, which showed that the Spree band was not always accurate. The Spree Band would sometimes have problems with grip and would slide around or not be fully pressed against the subjects head which would cause error in reading the temperature. Also, because there were many groups and test subjects, problems arose with the connection of the device when groups got too close to each other. Another error was the fact that the Spree band used colors, which aren't completely measurable, to gauge temperature; because of this, only one number could be assigned to each color, which is not very accurate.
Analysis
Upon testing the Spree band against a gold standard device, the Spree band was found to be lacking in the both areas it is said to measure: temperature and heart rate. While conducting this experiment, many design flaws were found in the Spree band, and even after the experiment was finished, more flaws were found. Overall, the Spree band was found to be very inaccurate in measuring heart rate and temperature. As discussed in the "results" section, the data from the Spree band and from the gold standard were statistically different, showing that the Spree band is giving undesired results. Consumers are looking for a convenient and accurate method to measure their temperature and blood pressure with the Spree band, something this device fails to deliver, as the data and observations show.
Summary/Discussion
When compared to the gold standard methods of measuring heart rate and body temperature, the Spree band is rather inaccurate. This is due to a few rather important design flaws in the device. The first design flaw is the fact that the headband reads body temperature from the forehead, which gives a reading which isn't very accurate. A possible remedy to this could be a supplementary device which was integrated with a pair of headphones, giving a body temperature reading from the inside of the ear, which is more accurate than from the forehead. This would also reduce the affect from environmental temperature on the reading, because the ear canal is a more isolated location. Another possible solution could be an adapted Spree band placed on the upper arm instead of on the head, similar to an mp3 player holder. The temperature reading device could be located near or in the armpit, which would allow for a more accurate reading. Also, the band could be made out of more absorbent material to absorb some of the sweat which may have affected the body temperature reading during the experiment. The application for the phone was also a major problem. The band sometimes was disconnected from the phone so a reading could not be taken. This problem could be solved with a wireless watch-type display which was unique to each different Spree band and would not be interfered by other Spree bands in the same area.
LAB 3B WRITE-UP
Target Population and Need
The target population for Neurospex is the elderly because they are the most susceptible to having strokes. Over 75% of all strokes occur in individuals that are 65 years old and older. Because of this reality, we designed Neurospex to be wore on glasses due to the fact that glasses are common among the elderly; however, we can still appeal to the general public as 61% of all people where glasses. Although this is the target population, anyone who thinks they have a chance of getting a stroke can buy and use Neurospex. Stroke is the fourth leading cause of death in the United States with over 800,000 people dying of a stroke each year according to the CDC. Therefore, there is a great need for a device like Neurospex as there is a large population of individuals that are at risk of a stroke. Early detection and getting to the hospital in time is the key to decreasing the amount of damage a stroke can cause. This is exactly what Neurospex does. Neurospex is a early detection device that will help stroke patients detect that they may be having a stoke so that they can make it to the hospital in time.
Device Design
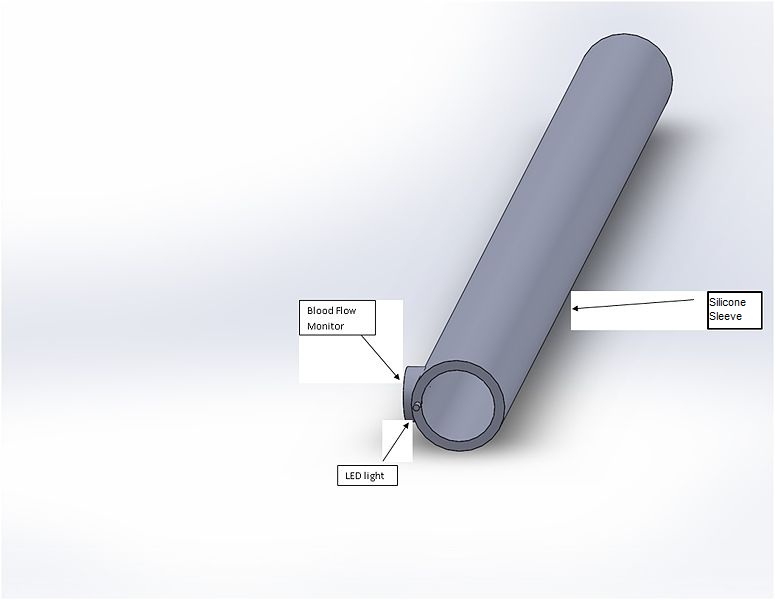
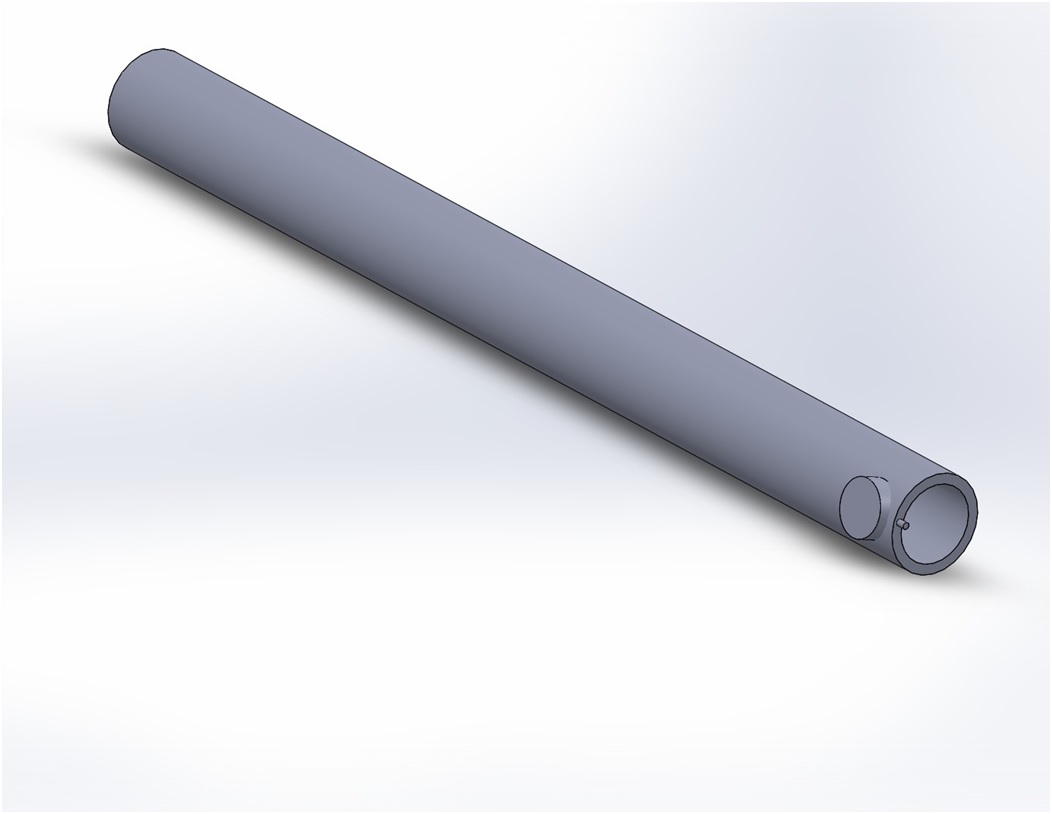
Neurospex are glasses straps that easily slip onto any pair of glasses and help detect a stroke. The silicone sleeve is a flexible, durable, and sweat-proof material that can contort to fit over the a patient's existing glasses and placed to be touching the patient's temples. There is a blood flow monitor with in Nerospex that does periodic, non-invasive scans of a patient's blood flow found on the patient's temples. Hardware resting inside the sleeve deciphers the data and stores it for a short time. If the cerebral blood flow is dramatic enough, as in there is significant drop in the patient's blood flow, the device will active the small LED light nestled inside the front of the device. The brightness of the light is enough that it can be seen in the peripheral vision of patients. The light will remain on until the device is manually reset. In addition, a sound will be played as the light goes on to serve as a secondary alert for the patient in the event the first is not enough. This will alert the user that their cerebral blood is low and that they may be having a stroke, thus bringing their attention to the matter and allowing them to take action immediately.
Design Flaws
Flaws in the design of Neurospex include that they are only designed for seniors who have glasses, the Neurospex might not fit every type of glasses, the user may experience some discomfort wearing the Neurospex as they get used to them, or the flashing lights and sounds may not be enough for a senior to sense the detection. These are minor flaws that can be fixed as more data is collected and the device is improved. The Neurospex is a revolutionary concept that will help many individuals get to the hospital in time to properly treat a stroke, so although there may be some flaws, the overall results should prove to be helpful for Neurospex users.
Inferential Statistics
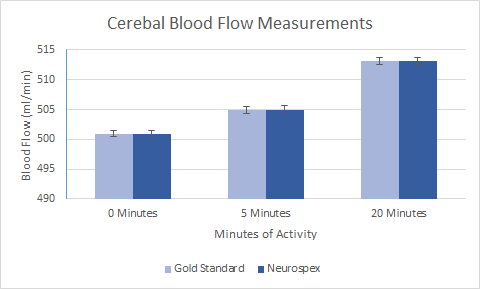
When Conducting the tests of 26 elderly subjects, the gold standard selected to measure cerebral blood flow or CBF was Transcranial Doppler Examination or TDE, this was in comparison to the Neurospex device. Three measurements were taken before, during, and after an activity would raise CBF levels in the subjects. The T-tests returned P values of .9935, 9820, .9801 respectively. Each values presents at least a 98% confidence level that there isn't a statistically significant difference which is displayed in the graph in form of small error bars. Neurospex has a strong case presented in the tests that it is identical and effective device to measure CBF when compared to the gold standard TDE.
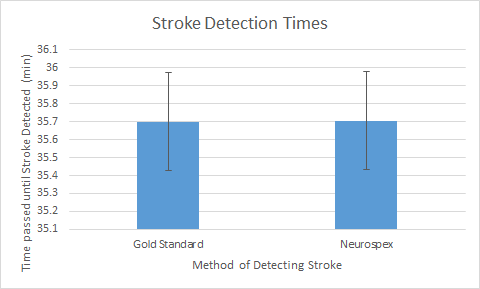
Further studies observed the detection times for the Neurospex was compared to a gold standard method of Single Photon Emission Computed Tomography or SPECT. Using rats and artificially inducing strokes on their brains, the times reported by the gold standard and the Neurospex activating that a stroke has occurred purported a T-Test of .9502, or over 95% confidence level that there isn't a statistically significant difference between the gold standard and the Neurospex readings. Despite showing large error bars, the graph is misleading, as the units are measured is in tenths of a minute. Between the two measurement sets the Neurospex measures up that as an effective tool to stroke diagnostic and receiving early medical attention that they would not have normally received.
Graph
Works Cited
http://en.wikipedia.org/wiki/Cerebral_blood_flow
