BME100 f2014:Group22 L3
Descriptive Statistics
Average Measured Values of Heart Rate and Temperature of Spree and Gold Standard Measurements
| Gold Standard: Temperature | Spree: Temperature | Gold Standard: Heart Rate | Spree: Heart Rate | |
|---|---|---|---|---|
| Average | 97.5 °F | 103 °F | 93.0 bpm | 93.2 bpm |
| Standard Deviation | 0.864 °F | 2.99 °F | 21.4 bpm | 21.7 bpm |
| Standard Error | 0.0321 °F | 0.0111 °F | 0.867 bpm | 0.878 bpm |
Graphs and Scatter Plots
Temperature Comparison
Heart Rate Comparison
Inferential Statistics
Temperature Comparison
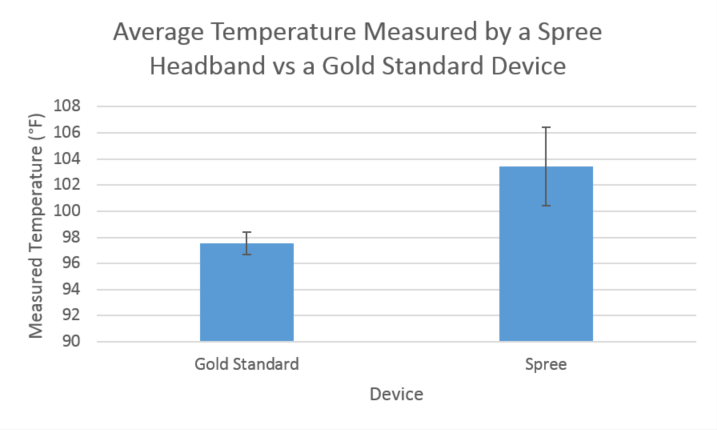
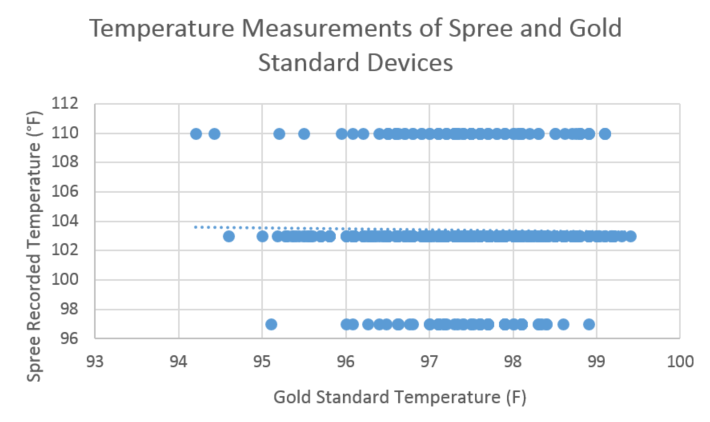
Overall, there was a significant difference between the measured temperature by the Spree band and the gold standard device, an oral thermometer. In order to determine statistical significance, a Student's T Test was performed in order to compare the entirety of the gold standard measurements to the entirety of the Spree measurements, each of which corresponded to one of the gold standard measurements. For the entire data set of temperature measurements, the T Test returned an associated p-value of 2.49 x 10-239. This p-value, metaphorical leagues below the 0.05 uncertainty margin, implies that there is an almost infinitesimally small chance that the entirety of the difference between the Spree measurements and the gold standard measurements was due to random chance. In other words, the Spree readings for temperature, measured using the arbitrary color scale, was, statistically, significantly different from those of the gold standard. As shown by the Temperature Measurements bar graph above, the difference of means was almost 6°F. The standard deviation, strengthened in meaning by the size of the sample, does not overlap between the two bars, implying visually that the difference cannot be explained by simple imprecision, but is at least in part due to an inaccuracy in the device. The scatter plot reveals the reason behind this, the the experiment created only four discrete readings from a continuous, unmarked scale. A Pearson's R-Test was done to determine the correlation of the data. The test returned a value of -0.017 which is essentially 0, given the context, therefore the Spree device is a very inaccurate way of measuring temperature.
Heart Rate Comparison
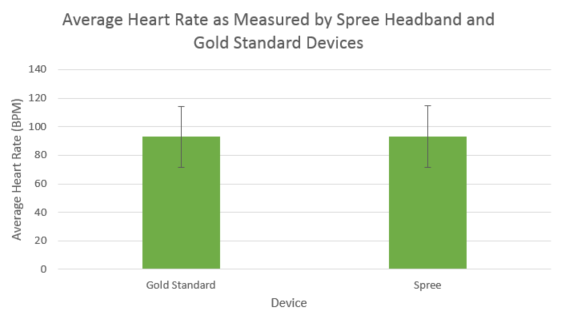
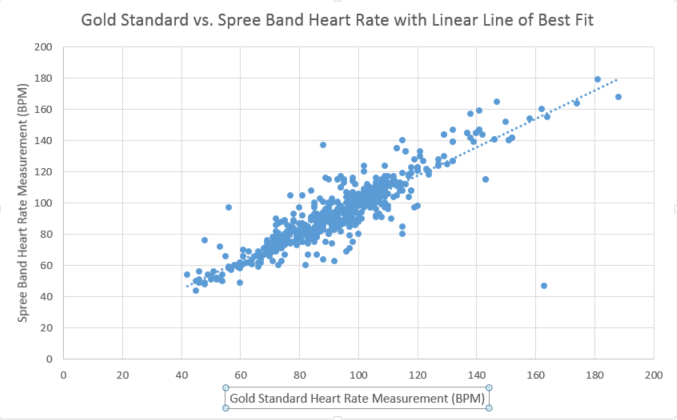
Overall, the measured heart rate of the Spree band and the gold standard devices were very similar, without a statistically significant difference between the two devices. As with the data for the temperature measurements, a T Test was performed in order to test for statistical significance between the two categories (spree vs. gold standard) for the entire data set, as well as between the individual sections (warm-up, walking, and cool-down). For the entire data set, the T Test returned a p-value of 0.50, meaning that there was no statistically significant difference between the two measurement devices. Individually, none of the different sections returned a low enough p-value (<0.05) to suggest that there was any significant difference between the two types of devices. The data was also laid out in the form of a scatter plot, which showed a fairly strong positive correlation between the Spree's measured heart rate and the gold standard's measured heart rate. The Pearson's R coefficient was 0.89, supporting the visual indication that the two values were fairly strongly linked. With a fair degree of certainty, it can be said that the Spree band is nearly as accurate and as precise as the gold standard devices are at determining heart rate.
Summary and Discussion
Design Flaws
Problem: The spree device holds on to sweat and creates a foul odor.
Solution: Make small ventilation holes use an antibacterial or breathable material so that it does not hold on to sweat.
Problem: It is hard to differentiate sprees from each other when trying to connect to a specific device.
Solution: Label the sprees with specific Bluetooth names or printed MAC addresses for easy identification (or allow the name to be changed by the user)
Problem: It is hard to wear a hat with the spree because the device is too thick.
Solution: Reduce the thickness of the spree headband as much as possible.
Problem: The band is not very comfortable.
Solution: A wider band to better distribute pressure around the head.
Problem: The band does not hold tightly enough for heavy running.
Solution: Design a slightly more elastic band, or one with better gripping surface.
Problem: It gets hot under the Spree. (your forehead sweats more, and it affects the temperature readings)
Solution: Use a more breathable material or include ventilation holes to allow for better air flow.
Problem: The device does not look appealing when worn.
Solution: Embed the Spree in an common athletic headband, or in a wrist device
A solution that would encompass a few of the problems with the Spree band is the inclusion of a variety of Spree holding bands that allow users to choose between having a headband, a wrist band, or an arm band. This could greatly increase the marketability by making the spree device more customizable and therefore widening its audience. In addition, the device was only compatible with the Spree app, which was only available on very recent models of the iPhone. The device could be greatly improved by creating Android app, along with compatibility with older models of iPhone or iPod. This would greatly increase the target audience to include nearly anybody with a smartphone. Alternate models could also be created to store workout data
Experimental Flaws
- The temperature measurement was a visual bar with corresponding colors, but it did not have a discrete, numeric reading for the temperature. Also, because of the lack of hard-set markings in the app, the four arbitrary levels (1-4, corresponding to specific temperatures) had little consistency between groups or even within the same one. This was because it was difficult to determine what range constituted a 1, 2, 3, or 4, and anything in that range corresponded to the same temperature. Therefore, it was extremely difficult to get an accurate estimate of the numeric temperature measurement, reducing the precision of the device to almost unusable data, from a scientific standpoint.
- Some people measured their gold standard temperature in Celsius instead of Fahrenheit, there was some accuracy lost in the conversion to Fahrenheit.
- Different groups used different types and brands of gold standard measurement devices (blood pressure cuffs and pulse oxymeters), so the gold standard data was made less reliable by the fact that there is now at least a little bit of uncertainty in the measurements that reduces the overall comparability of the groups to one another.
- A solution for this would be to use the same type of gold standard device across all trials (pulse oxymeter, blood pressure cuff, etc.)
- One of the major issues with the temperature measurement was that it measured temperature from the forehead, which could not give an adequate measurement of the person's core body
temperature, but rather their surface skin temperature.
New Product Design: The Drinking Buddy
Device Details: Target Population and Need
Identifying an Audience with a Need
In many college settings, as well as beyond, many young adults consume alcohol alone or at large social events. Given the nature of the college and young adult experience, with many young men and women experiencing freedom more than ever before, many who consume alcohol are at risk of alcohol poisoning as well as the risky behavioral effects of drinking. With drunk driving and other alcohol-related deaths and injuries costing many lives per year, there is a need in society, not just for college students and young adults, to be able to accurately their bodies' state of intoxication. A method of measuring one's Blood Alcohol Content (BAC), coupled with an adequate understanding of the measurement, could be extremely useful in avoiding drunk driving, alcohol poisoning, and many of the other risks of drinking, especially those that come with being in an unfamiliar setting. A device capable of monitoring and displaying a person's BAC could also be useful for concerned friends or other party-goers in acting as a safety net for avoiding risks and preventing the catastrophes that can be caused by drunk driving.
Designing a Product: The Drinking Buddy
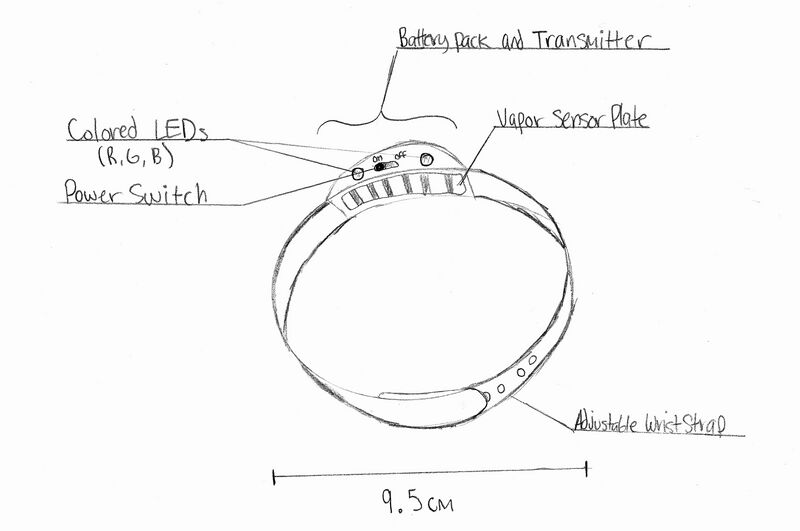
The Drinking Buddy is a device that is worn around the wrist and measures the blood alcohol content of the wearer, and is designed to be used by college students, young adults, and anyone else that frequents parties where alcohol is involved. Similar to state-issued ankle cuffs, the drinking buddy incorporates a sensor that precisely measures BAC based on the trace alcohol vapor concentration in sweat. It incorporates bright LED lights around the length of the device that change color from green to yellow to red, indicating that the wearer is safe, at risk (near the legal limit, 0.08%), or in dangerous territory (0.20% and above), respectively. The LED lights also change intensity, glowing more brightly as the wearer's BAC rises, and blinking at an increasing tempo at a BAC of 0.08% and above, indicating that the wearer is not in a condition to drive, so that the wearer and other party-goers can prevent drunk driving. In addition to the colored light display on the wristband, the device can also connect wirelessly to any smartphone or bluetooth-enabled device to display the precise BAC level of the wearer, as well as to send alerts and notifications to the wearer's and selected recipients' phones, alerting them when user-set BAC limits have been passed. The device is powered by a small, long-lasting lithium-ion battery near the sensor module, which is passively recharged by small movements and body heat.
Marketing
The Drinking Buddy will be marketed primarily towards the most at-risk groups, including college students and frequent party-goers. The slogan is "Never Drink Alone," with the intent to instill a sense of safety/support in legal consumers of alcohol.
Product Diagram
Data and Statistics
A spreadsheet with the full data set, graphs, and calculations can be viewed here.
Descriptive Statistics: Drinking Buddy vs. Gold Standard (Breathalyzer)
| Breathalyzer | Drinking Buddy | |
|---|---|---|
| Average | 0.0496% | 0.0543% |
| Standard Deviation | 0.380% | 0.382 |
| Standard Error | 0.00362 | 0.036 |
Inferential Statistics
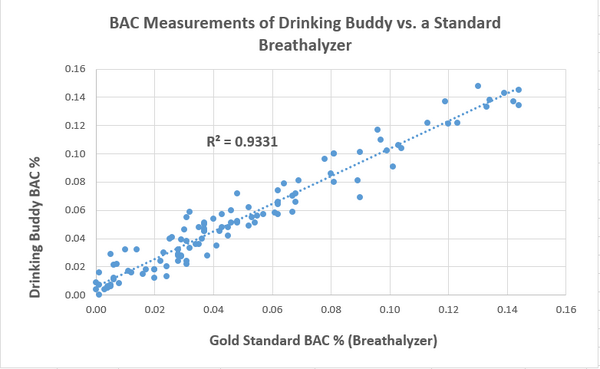
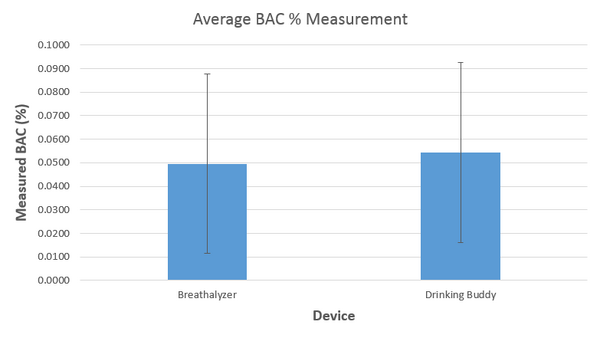
In order to test for statistical significance, a Student's T Test was performed to compare the data of both the Drinking Buddy device and a gold standard measurement device, a breathalyzer, both measuring blood alcohol content (BAC) in percent volume. The data was also plotted on a scatterplot and a bar graph of the average values, including visual representations of the correlation (with Pearson's R2) and standard deviation, both of which can be viewed below. The T Test returned an uncertainty value of 0.36, well above the maximum uncertainty allowable to signify a statistically significant difference. Therefore, it can be said that there is no statistically significant difference between the measurements of the Drinking Buddy device and the gold standard breathalyzer test in detecting blood alcohol content. This is further supported by the Pearson's R2 value of 0.95, denoting a strong positive correlation between the two measurements, indicating a reasonably low margin of error for the Drinking Buddy's measurement when compared to the breathalyzer. This result is also shown by the small difference in means compared to the standard deviations of either data set, as shown by the bar graph of the data set.
