BISC110/S12: Series 1 Lab 2 Tetrahymena Behavior
Objectives: In this lab you will learn:
- Scientific observation
- Measurement of specimens using the micrometer
- Experimental design
- Effective Figure design
Series 1 Lab 2 Tetrahymena Phagocytosis
Adapted from Bozzone, M.D., and D.A. Martin 2000. An experimenal system to study phagocytosis. Pages 405-415, in Tested studies for laboratory teaching, Volume 21 (S.J. Karcher, Editor). Proceedings of the 21st Workshop/Conference of the Association for Biology Laboratory Education (ABLE).
In this laboratory, you will study Tetrahymena phagocytosis in the presence of India ink. You will have the opportunity to make scientific observations and learn some of the ways that scientific data are evaluated and presented.
PART I: Ink and Tetrahymena Behavior
You will be provided with 1% India ink and live Tetrahymena for this lab. You will add 1% ink to the Tetrahymena and make observations. Based on your careful observations, you will collect some data to quantify Tetrahymena phagocytosis in the presence of India ink.
A. Observations of Tetrahymena Exposed to India Ink
- In a microcentrifuge tube, add 50 μL of 1% ink solution and then add 50 μL of live Tetrahymena. Mix gently and record the time.
- Add 20 μL of the Tetrahymena pyriformis and ink solution that you made in step1 to a glass slide. Add a cover slip and view using the microscope. If you need to review how to focus the microscrope, refer to the directions in Lab 1. You may need to adjust the field diaphragm or to lower the condenser a bit to see the cellular structures clearly. Record your observations in your notebook.
- Do you see any ink particles inside the Tetrahymena? Be sure to note the time as soon as you notice an ink filled phagocytic vacuole forming. Continue observing the Tetrahymena at 5, 10, and 15 minutes post ink challenge. Using a digital camera, take photos of the Tetrahymena at each time point. Please refer to Appendix_J/F11 for detailed camera instructions. Note the number of filled or empty vacuoles, where the vacuoles are (near the center or the periphery), the size of the vacuoles (use the micrometer in one of the eyepieces in your microscope), or other variables as directed by your instructor. Record this information in tables you create in your lab notebook.
- Put on a pair of gloves. After 15 minutes, add 20 μL of the Tetrahymena and ink solution to a clean labeled microcentrifuge tube. IN THE HOOD, add 10 μL of 3% gluteraldehyde to your Tetrahymena and ink solution. The gluteraldehyde will fix the cells, allowing you to observe the Tetrahymena in more detail. Still in the hood, add 20 μL of the resulting 30 μL mixture to a glass slide and place a cover slip on top. The glass slide containing fixed Tetrahymena can now be removed from the hood and observed under a microscope.
- Count the number of ink filled vacuoles in 5 individual Tetrahymena and record this information in your lab notebook.
- Using the micrometer, measure the size of these phagocytic vacuoles inside the Tetrahymena. Measure at least 1 vacuole from at least 5 individual Tetrahymena. Check with your instructor to be sure that you are measuring the correct structure. Did you see them form? Describe the process of phagocytosis in Tetrahymena in your lab notebook.
- Use a digital camera to take pictures of the fixed Tetrahymena. For at least one photographed cell, be sure to note the size of the cell and one clear ink filled vacuole. Please refer to Appendix_J/F11 for detailed camera instructions. When you are done with the slide containing gluteraldehyde, place it in the waste container in the hood.
PART II: Data Analysis and Effective Figure Design
You will now have the opportunity to think about your experimental data and if there are conclusions that you can draw about how Tetrahymena perform phagocytosis. How you might present your data to support your conclusions in the form of figure(s)? Before you attempt that data presentation, your instructor will first lead a discussion on some important concepts in experimentation and data analysis using figures from the Gronlien et al. article, In the polymorphic ciliate Tetrahymena vorax, the non-selective phagocytosis seen in microstomes changes to a highly selective process in macrostomes, in The Journal of Experimental Biology 205, 2089–2097 (2002), (one of the articles that you consulted for your homework).
Other Concepts in Experimentation
A. Accuracy and Precision
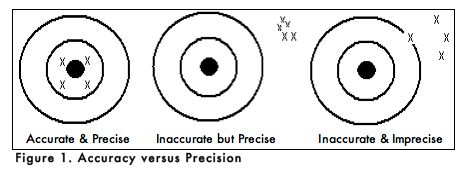
When carrying out an experiment, it is important to do the experiment more than one time to be sure that your measurements are accurate and as precise as possible. Accuracy is the degree of agreement between the measured value of a particular component and the accepted true value. Precision is defined as the degree of agreement between replicate measurements of the same component. Precise measurements do not necessarily indicate accurate measurements. Figure 1 uses targets to illustrate the difference between accuracy and precision. If the bull’s eyes in the targets below represent the true value, then the darts that are the closest to the center of the target are the most accurate. Darts that are not near the center of the target are not accurate even though they may be very closely grouped together indicating good precision. Finally, the darts that are not near the center or grouped together are neither accurate nor precise. Measured values that are both accurate and precise are the goal of all analytical procedures.
As with all analogies, the one above does not address an important issue that comes up in scientific experimentation. For example, when you observed the Tetrahymena after 30 minutes in the 1% ink solution, did each of the 10 cells that you counted have the same number of filled phagocytic vesicles or the same number of ink particles in each vacuole? If not, were you inaccurate or imprecise in your data collection? Or, is it possible that another factor accounted for the data you collected? Do you expect every individual Tetrahymena to behave the same in the presence of ink? Why or why not?
B. Statistical Parameters
For various reasons, replicate analytical measurements do not always result in exactly identical values, and so statistical calculations are often used to evaluate analytical data. The validity of these calculations is linked to the number of replicate measurements, so a high number of measured values will yield the most valid statistical evaluation. A short explanation of several elementary statistical parameters on replicate measurements are provided below.
1. Median Value
If all the replicate values for a series of measurements were ordered from the lowest value to the highest value, then the midpoint value is the median. For example, if a series of measured millimolar (mM) concentrations of NaCl are 10.1, 10.2, 10.3, 10.5, and 10.7mM, the median value would be 10.3mM.
2. Range of Values
The range is the difference between the highest measured value and the lowest measured value in a series of replicate measurements, and is a simple indicator of precision. A wide range in replicate measured values indicates poor precision. The range is calculated by subtracting the lowest replicate value from the highest. For the above concentrations of NaCl, the range would be calculated as:
3. Mean Value
The mean value is simply the arithmetic average of all the replicate values, and is generally considered to be more accurate than any individual measured value. The mean is calculated by adding all the measured values and dividing by the number of measured values or sample size. The mean value is represented mathematically as:
The mean of the NaCl concentrations from step #1 is calculated as follows:
4. Standard Deviation
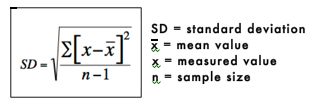
The standard deviation is a measure of how spread out or variable the values are. The standard deviation is calculated by subtracting the mean from each value and then squaring and summing these values. The resulting value is divided by n-1, where n is the number of values. The square root of these values is the standard deviation. The standard deviation is represented mathematically as:
The standard deviation of the sodium chloride values is calculated as follows:
Laboratory Cleanup
- Place used microcentrifuge tubes that do not contain gluteraldehyde in autoclave bags taped above your bench. Place used tips that do not contain gluteraldehyde in the regular trash container. Any microcentrifuge tubes containing gluteraldehyde should be disposed of in the hood.
- Put all used microscope slides and cover slips that do not contain gluteraldehyde in the glass disposal box. Slides containing gluteraldehyde can be disposed of in the waste container located in the hood.
- Proper storage of your microscope: Clean the objective lenses of your microscope, beginning with the lowest power (4x) and proceeding to the highest. Use lens tissue (NOT Kimwipes®). Make sure that there there is NO oil on any lens. Rotate the 4x objective lens into the locked viewing position. The binocular head must be rotated into the storage position, to protect the ocular lenses from damage. Loosen the setscrew on the right, rotate the head 180°, then retighten the screw. Turn off the microscope light. Return the microscope to the cabinet with its plastic dust cover on.
Assignments
1. Read and study the information about dilution making in Lab 3 and make sure you understand how to make dilutions and how to calculate final concentrations after making dilutions.
2. You exposed Tetrahymena to ink and observed the number of ink filled vacuoles in 15 cells at both 10 minutes and 30 minutes. You obtained the following data for the number of filled vacuoles at each time point:
Calculate the means and standard deviations of ink filled vacuoles at 10 and 30 minutes. Plot the data in a bar graph with time on the X axis and the average number of filled vacuoles on the Y axis. Use error bars to denote the standard deviation. Refer to Appendix A for instructions on how to calculate standard deviations and generate a bar graph with custom error bars. Be sure to include an appropriate caption with the graph.
3. Generate two figures from your ink concentration experiment. The first figure should include one or more photographs of Tetrahymena at different time points during your experiment and the second figure should contain a graph of some or all of the data. Both figures should include figure legends. In the Resources section of the lab wiki, find the Guide to Scientific Writing. Refer to the sections on figures and legends for help. The Wellesley College Computing website has directions for downloading software, such as Photoshop (listed under Adobe CS), including directions for using it to edit your digital photos. The link for PCs (search under A for Adobe after getting to the page) is (PC) and for Mac OS operating systems it's (MAC). If you have a Mac, you might prefer to use Iphoto to edit your images. It works well too as do other imaging programs.


