BISC110/F12: Series 1 Lab 2 Tetrahymena Behavior
Objectives: In this lab you will learn:
- Scientific observation
- Measurement of specimens using the micrometer
- Experimental design
- Effective Figure design
Series 1 Lab 2 Tetrahymena Phagocytosis
Adapted from Bozzone, M.D., and D.A. Martin 2000. An experimenal system to study phagocytosis. Pages 405-415, in Tested studies for laboratory teaching, Volume 21 (S.J. Karcher, Editor). Proceedings of the 21st Workshop/Conference of the Association for Biology Laboratory Education (ABLE).
In this laboratory, you will study Tetrahymena phagocytosis in the presence of India ink. You will have the opportunity to make scientific observations and learn some of the ways that scientific data are evaluated and presented.
PART I: Ink and Tetrahymena Behavior
You will be provided with 1% India ink and live Tetrahymena for this lab. You will add 1% ink to the Tetrahymena and make observations. Based on your careful observations, you will collect some data to quantify Tetrahymena phagocytosis in the presence of India ink.
A. Observations of Tetrahymena Exposed to India Ink
- In a microcentrifuge tube, add 50 μL of 1% ink solution and then add 50 μL of live Tetrahymena. Mix gently and record the time.
- Add 20 μL of the Tetrahymena pyriformis and ink solution that you made in step 1 to a glass slide. Add a cover slip and view using the microscope. If you need to review how to focus the microscrope, refer to the directions in Lab 1. You may need to adjust the field diaphragm or to lower the condenser a bit to see the cellular structures clearly. Record your observations in your notebook.
- Do you see any ink particles inside the Tetrahymena? Be sure to note the time as soon as you notice an ink filled phagocytic vacuole forming. Continue observing the Tetrahymena. After you have had a chance to observe the "Tetrahymena" in the presence of ink, you will have a chance to do an experiment in which you collect data to present in the form of two figures.
- To begin your experiment, add 50 μL of 1% ink solution and then add 50 μL of live Tetrahymena. Mix gently and record the time.
- Put on a pair of gloves. After 0, 5 and 15 minutes, add 20 μL of the Tetrahymena and ink solution to a clean labeled microcentrifuge tube. IN THE HOOD, add 10 μL of 3% gluteraldehyde to your Tetrahymena and ink solution and wait for 1 minute. The gluteraldehyde will fix the cells, allowing you to observe the Tetrahymena in more detail. Then add 2 μL of 2.5 M glycine to inactivate the gluteraldehyde. Wait for 1 minute and then remove the tube from the hood.
- Add 20 μL of the resulting 32 μL mixture to a glass slide and place a cover slip on top.
- Using a digital camera, take photos of the Tetrahymena at the 0, 5, and 15 minute timepoints. Please refer to the directions below, B. Use of the Cannon A620 and A630 Digital Cameras, or to Appendix H for detailed camera instructions.
- Count the number of ink filled vacuoles in 10 individual Tetrahymena and record this information in your lab notebook.
- Using the micrometer, measure the size of these phagocytic vacuoles inside the Tetrahymena. Measure at least 1 vacuole from at least 5 individual Tetrahymena. Check with your instructor to be sure that you are measuring the correct structure. Did you see them form in step 1? Describe the process of phagocytosis in Tetrahymena in your lab notebook.
B. Use of the Canon A620 and A630 Digital Cameras
Focus your microscope slide image.
Record the total microscope magnification in your laboratory notebook.
We own several Canon digital cameras: A620 models with a resolution of 7MP (megapixels) and A630 models with a resolution of 8MP. The A620 and A630 models are essentially the same camera. Our strategy will be to capture images at the highest resolution (7 or 8 MP) of the camera, transfer them to the computer and use Photoshop to edit.
- Pull out the viewfinder and flip it so you can see the screen on the back of the camera.
- To take a photo, make sure the switch on the back of the camera is set to the red-camera-icon position (live image mode).
- Set the camera to auto on the wheel at the top of the camera near the on/off button.
- Turn off the flash by pushing the function wheel on the back of the camera under the lightning (flash) symbol. If the flash is off the flash symbol will have a line through it on the screen.
- Push the zoom all the way to the left so that you've zoomed out all the way.
- Place the camera lens against the microscope ocular lens containing the ocular micrometer.
- Move the camera lens around the microscope eyepiece to find the image. This takes a little practice and patience. The camera lens should not touch the microscope eyepiece. The image field is circular.
- Rest your left hand on the side of the microscope eyepiece and cup your fingers around the lens of the camera and the microscope. This will stabilize the camera and facilitate obtaining the best image. The camera lens should be about a quarter of an inch or so from the ocular lens.
- The camera will automatically focus the image. When you have obtained an evenly illuminated circular image field, gently press the exposure button at the top of the camera to take the picture.
- To transfer captured images to the computer, slide the switch on the back of the camera from the red-camera-icon position (live image mode) to the blue-arrowhead-icon position (captured-image review mode).
- Plug the USB cable into the computer keyboard port located on back of keyboard, then into camera port. The iPhoto window opens up. Check box to delete image from camera.
- Click Import to download your image into the iPhoto Library folder. Confirm that the “Delete originals” button is selected.
- In the File menu, select Export... The Export Photos window opens. Select “Full-size images” and “Original” format. Click Export button.
- A window shade drops down in the Export Photos window. Rename your file in the Save As text box and choose Desktop as your destination. Click OK. Close the iPhoto window.
- Launch Adobe Photoshop. In the File menu, select Open… The “Open” window appears. Find and select your image, then click Open.
- In the Embedded Profile Mismatch window, select “Use the embedded profile…” and click OK. Your image opens.
- Select the “Rectangular Marquee Tool” by typing the letter M on the keyboard. Drag cursor to select desired portion of your circular image, including a segment of the ocular micrometer. This yields a conventional rectangular image suitable for use in a paper.
- In the Image menu, select Crop. The selected portion of your picture appears on the desktop.
- In the Image menu, select Image Size... The “Image Size” window appears. Make sure the Constrain Proportions box is checked. In the Document Size portion of the window, decrease the larger of the two image dimensions to 4 inches. Click OK.
- In the File menu select Save As… and rename file. Use JPEG as the image Format. Click Save. JPEG Options window opens. Set Quality to Maximum (10). Click OK. This will create a small file of about 150–300KB in size. Delete the original large (3MB) image file.
- Email the images to yourself and to your partner(s). Check with your instructor to if she/he would like them uploaded to the lab Sakai site.
PART II: Data Analysis and Effective Figure Design
You will now have the opportunity to think about your experimental data and if there are conclusions that you can draw about how Tetrahymena perform phagocytosis. How might you present your data to support your conclusions in the form of figure(s)? Before you attempt that data presentation, your instructor will first lead a discussion on some important concepts in experimentation and data analysis using figures from the Gronlien et al. 2002 article (one of the articles that you consulted for your homework).
Other Concepts in Experimentation
A. Accuracy and Precision
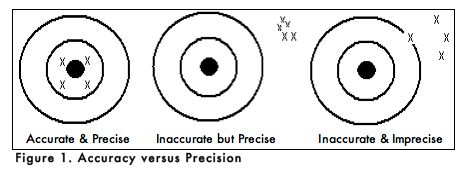
When carrying out an experiment, it is important to do the experiment more than one time to be sure that your measurements are accurate and as precise as possible. Accuracy is the degree of agreement between the measured value of a particular component and the accepted true value. Precision is defined as the degree of agreement between replicate measurements of the same component. Precise measurements do not necessarily indicate accurate measurements. Figure 1 uses targets to illustrate the difference between accuracy and precision. If the bull’s eyes in the targets below represent the true value, then the darts that are the closest to the center of the target are the most accurate. Darts that are not near the center of the target are not accurate even though they may be very closely grouped together indicating good precision. Finally, the darts that are not near the center or grouped together are neither accurate nor precise. Measured values that are both accurate and precise are the goal of all analytical procedures.
As with all analogies, the one above does not address an important issue that comes up in scientific experimentation. For example, when you observed the Tetrahymena after 15 minutes in the 1% ink solution, did each of the 10 cells that you counted have the same number of filled phagocytic vacuoles? If not, were you inaccurate or imprecise in your data collection? Or, is it possible that another factor accounted for the data you collected? Do you expect every individual Tetrahymena to behave the same in the presence of ink? Why or why not?
B. Statistical Parameters
For various reasons, replicate analytical measurements do not always result in exactly identical values, and so statistical calculations are often used to evaluate analytical data. The validity of these calculations is linked to the number of replicate measurements, so a high number of measured values will yield the most valid statistical evaluation. A short explanation of several elementary statistical parameters on replicate measurements are provided below.
1. Median Value
If all the replicate values for a series of measurements were ordered from the lowest value to the highest value, then the midpoint value is the median. For example, if a series of measured millimolar (mM) concentrations of NaCl are 10.1, 10.2, 10.3, 10.5, and 10.7mM, the median value would be 10.3mM.
2. Range of Values
The range is the difference between the highest measured value and the lowest measured value in a series of replicate measurements, and is a simple indicator of precision. A wide range in replicate measured values indicates poor precision. The range is calculated by subtracting the lowest replicate value from the highest. For the above concentrations of NaCl, the range would be calculated as:
3. Mean Value
The mean value is simply the arithmetic average of all the replicate values, and is generally considered to be more accurate than any individual measured value. The mean is calculated by adding all the measured values and dividing by the number of measured values or sample size. The mean value is represented mathematically as:
The mean of the NaCl concentrations from step #1 is calculated as follows:
4. Standard Deviation
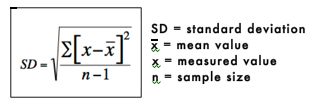
The standard deviation is a measure of how spread out or variable the values are. The standard deviation is calculated by subtracting the mean from each value and then squaring and summing these values. The resulting value is divided by n-1, where n is the number of values. The square root of these values is the standard deviation. The standard deviation is represented mathematically as:
The standard deviation of the sodium chloride values is calculated as follows:
5. Practice Data Analysis
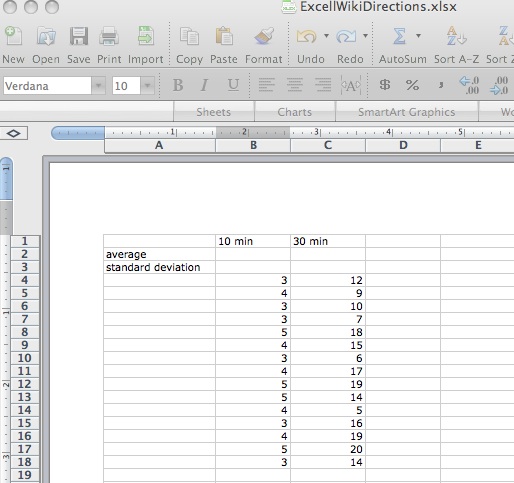
Imagine that you exposed Tetrahymena to ink and observed the number of ink filled vacuoles in 15 cells at both 10 minutes and 30 minutes. You obtained the following data for the number of filled vacuoles at each time point:
Calculate the means and standard deviations of ink filled vacuoles at 10 and 30 minutes. Refer to the Generating Graphs and Error Bars with Microsoft Excel instructions found below or in Appendix A and plot the data in a bar graph with time on the X axis and the mean number of filled vacuoles on the Y axis. Use error bars to denote the standard deviation.
Generating Graphs and Error Bars with Microsoft Excel
- To launch Excel, click on the icon in the dock at the bottom of the screen. An Excel Workbook will open. If Microsoft Excel is already open, select New Workbook from the File menu to display a new spreadsheet.
- To determine the mean and standard deviation, write Average in cell A2 and Standard Deviation in cell A3. List variable 1 in cell B1, variable 2 in cell B2… Now enter the number of filled vacuoles per cell for variable 1 in cells B4, B5, B6... Enter the number of filled vacuoles per cell for variable 2 in cells C4, C5, C6…

- Be sure that the formula builder bar under view is selected.
- To determine the average value for variable 1 (10 min), click on cell B2, press the = symbol, click on the upper left pull down menu and select AVERAGE, highlight cells B4-B18 and press return. The average value should now appear in cell B2.
- To determine the standard deviation for variable 1, click on cell B3, press the = symbol, click on the upper left pull down menu and select STDEV, highlight cells B4-B18 and press return. The standard deviation value should now appear in cell B3.
- To determine average and standard deviation values for variable 2 (30 min), highlight cells B2 and B3, select the lower right square on the highlighted box with the black + symbol, drag to the right until you reach cells C2 and C3, and then release the mouse. The average and standard deviation values for variable 2 should now appear in cells C2 and C3.
- To make your graph, click on cell A1. While keeping the mouse clicked, drag mouse to cell C3 so that cells A1, A2, B1, B2, C1, and C2 are all highlighted.
- Click on the Charts tab below the toolbar. A gallery of chart types will appear below. Press the Column button below to display the appropriate charts in this so-called Elements Gallery.
- To select the proper chart type from the Elements Gallery, press the “Clustered Column” thumbnail (all the way to the left). A chart will appear on the worksheet.
- Open the Formatting Palette by pressing on the Toolbox icon. Under Chart Options you can label the axes and provide a title.
- To add error bars, double click on the columns on your graph. The format data series box will appear. Select Error Bars on the left. Under display, select Both. Under error amount, select Custom and Specify Value. The Custom Error Bars chart will appear. Clear any values in the Positive Error Value box and then highlight the standard deviation values that you calculated previously. Do the same with the Negative Error Values. Click OK twice.
- The chart may be created as an object in the worksheet, or it may be displayed as a new sheet. Under the Chart menu select Move Chart... to choose between these two options.
- Double-clicking on either axis will allow you to change the scale, font and other features of the axis.
Laboratory Cleanup
- Place used microcentrifuge tubes that do not contain gluteraldehyde in autoclave bags taped above your bench. Place used tips that do not contain gluteraldehyde in the regular trash container. Any microcentrifuge tubes containing gluteraldehyde should be disposed of in the hood.
- Put all used microscope slides and cover slips that do not contain gluteraldehyde in the glass disposal box. Slides containing gluteraldehyde can be disposed of in the waste container located in the hood.
- Proper storage of your microscope: Clean the objective lenses of your microscope, beginning with the lowest power (4x) and proceeding to the highest. Use lens tissue (NOT Kimwipes®). Make sure that there there is NO oil on any lens. Rotate the 4x objective lens into the locked viewing position. The binocular head must be rotated into the storage position, to protect the ocular lenses from damage. Loosen the setscrew on the right, rotate the head 180°, then retighten the screw. Turn off the microscope light. Return the microscope to the cabinet with its plastic dust cover on.
Assignments
- Read and study the information about dilution making in Lab 3 and make sure you understand how to make dilutions and how to calculate final concentrations after making dilutions.
- (5 points) Generate two figures from your ink experiment. This assignment must be done individually. The first figure should include one or more photographs of Tetrahymena at different time points during your experiment and the second figure should contain a graph of some or all of the data. Both figures should include figure legends. In the Resources section of the lab wiki, find the Guide to Scientific Writing. Refer to the sections on figures and legends for help. The Wellesley College Computing website has directions for downloading software, such as Photoshop (listed under Adobe CS), including directions for using it to edit your digital photos. Go to Welleseley's Information Technology home page on the Wellesley web site to find Software downloads for PCs and Macs (search under A for Adobe after getting to the page to download applications for your Computer type ). If you have a Mac, you might prefer to use your already installed iPhoto application to edit your images. It works well as do other imaging programs.


