Appendix B/S13
APPENDIX B: Use of the Spectronic20+ Spectrophotometer
The Spec20+ is used to measure the absorbance of a sample at a set wavelength.
An animation of how to use a Spec 20+ can be found at: | Spec20 Instructions
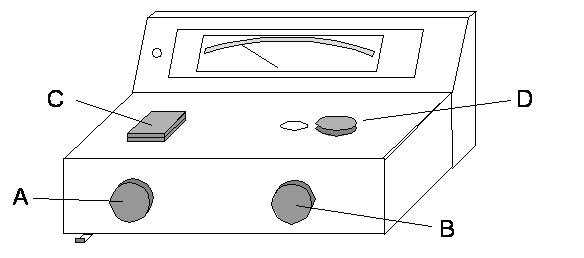
A diagram and general instructions for use of the Spectronic20+® (Spec20, informally) are provided. Please read the instructions before beginning the laboratory exercises. The meter on the Spec20 has 2 scales: a logarithmic scale for absorbance (A) and a linear one for percent transmittance (%T). We will use the %T scale to zero and to blank the instrument. We will use the A scale to take absorbance readings. Your instructor is available to answer any questions regarding the use of the spectrophotometer.

Figure 4. A Diagram of the Spectronic20+ Spectrophotometer.
- Turn on instrument at least 30min before use with On-Off Knob (A).
- Set the desired wavelength using Wavelength Selector (D).
- Insure that the filter lever located at bottom front of instrument is in correct position for the wavelength that you have selected (to the left for wavelengths 340-599nm; to the right for wavelengths 600-950nm).
- Use Zero-Adjust Knob (A) to set meter to 0%T.
- Be sure that your sample is loaded in a 13mm test tube, not a plastic cuvette.
- Wipe outside of test tube that contains the blank solution with a Kimwipe, insert it into the Tube Holder (C), and close the lid.
- Use 100% Adjust Knob (B) to set meter to 100%T, which is equivalent to zero absorbance on the absorbance scale. Remove the blank tube.
- Wipe the outside of the test tube that contains the sample, insert it into the Tube Holder (C), and close the lid.
- Record the absorbance reading from the absorbance scale, and remove the sample tube.
- Repeat steps 7-8 for other samples to be read at the same wavelength (e.g., standard curve data). Repeat steps 2-8 for samples to be read at different wavelengths (e.g., absorption spectrum data).
