Objectives
- Obtain UV/Vis spectra for Au/Lysozyme samples with varying mole ratios.
- Purify ADA from E. Coli
Procedure
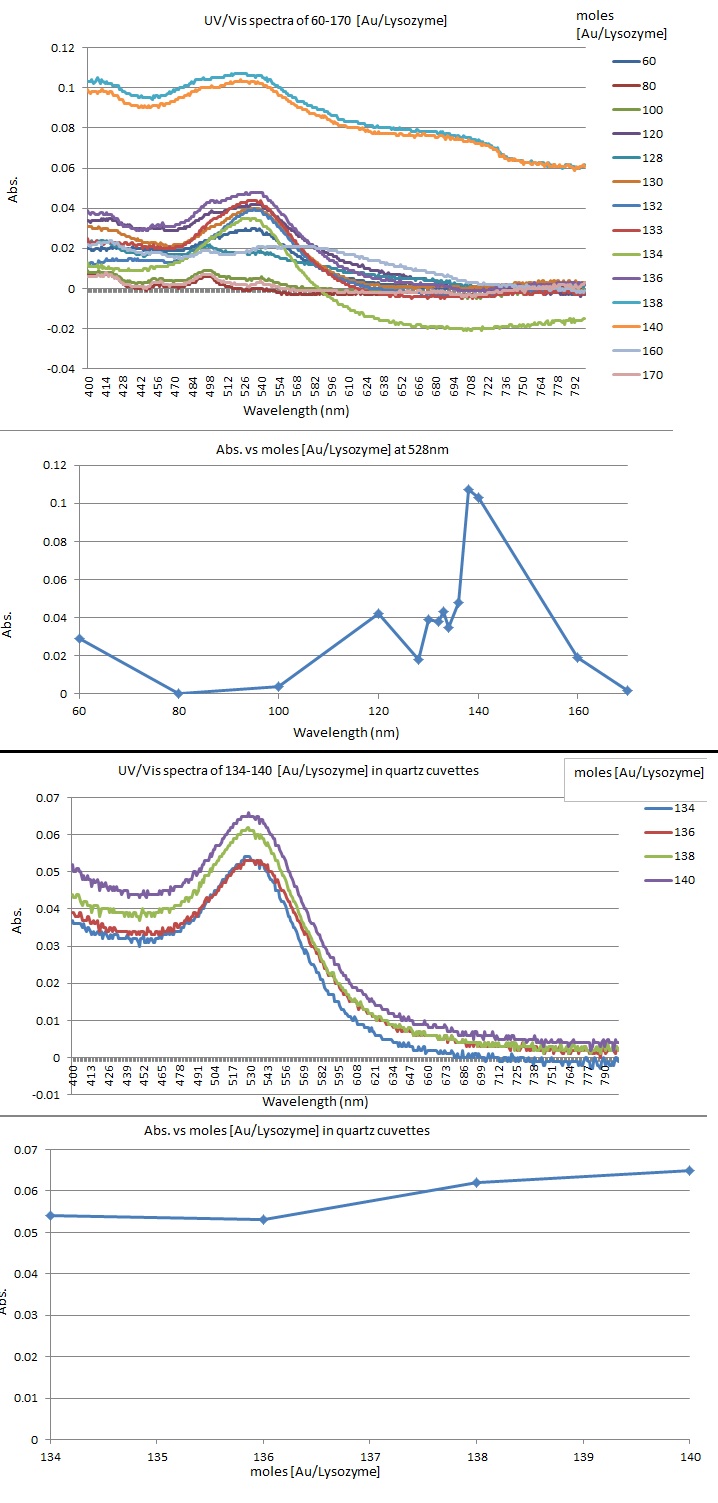
- Au/Lysozyme samples prepared last Wednesday were analyzed by UV/Vis using disposable plastic cuvettes. The instrument held a blank cuvette of water, which was automatically subtracted from the spectra of the Au/Lysozyme.
- Samples from 134-140 showed variation in the background. In order to determine whether this was due to Lysozyme or variation in cuvettes, these trials were repeated using the same quartz cuvette. A blank of water was run using the same cuvette and subtracted from each spectra manually.
- Puja Moody purified ADA from E. Coli grown last week
Data
Discussion
- In the abs. vs mole ratio plot for the first round, done using plastic cuvettes, a jagged line is seen from 134-140. A significant change in backgrounds is seem on the wavelength vs. absorbance graph. Because of this, we analyzed these samples again using quartz cuvettes.
- Starting at 100, an increasing amount of AuNPs appear in solution. This peaks at 140 before decining to near-zero at 170. This indicates that the optimal mole ratio for AuNPs in solution is 140 and that they start to go into fibers at higher mole ratios.
|
