20.109(S11):Complete DNA design (Day2)
Introduction
The edge detector design harnesses a lot of interesting biology, such as 2-component signaling and quorum sensing. We'll talk about these ways that bacteria get information about the outside world next week. For today, our focus is on bacteriophage lambda, in order to best understand how we might modify the Plux-λ promoter.
Bacteriophage, or phage for short, are viruses that infect bacteria. They are abundant and also various in their physical characteristics and the mechanisms they use to propagate. Phage lambda is a very well-characterized phage and an excellent model for understanding the fundamentals of gene regulation, as described by Mark Ptashne in his excellent book A Genetic Switch: Phage λ and Higher Organisms. Despite having only 50,000 bp of DNA to work with, λ is able to exist in two distinct states — lytic or lysogenic — and switches between them depending on environmental cues. The switch is effected through a sophisticated interplay of molecular interactions among proteins and DNA.
While you do not need to understand the mechanism of the switch in detail, you do want to be familiar with most of its components. The switch comprises two promoters and three operators, of which one promoter and two operators are part of Plux-λ. The image below shows the DNA that makes up promoter PR. Notice that PR (bracketed) has some overlap with two different operator sites, OR1 and OR2 (inside green boxes). The -35 and -10 regions of the promoter are shown in boldface blue text; notice again that these overlap in part with the operator sites. The leftmost -35 region belongs to a different promoter, PRM, whose associated gene is transcribed in the opposite direction; this promoter also overlaps with the third of three operator sites, OR3, that together comprise operator OR (the R stands for "right"). One thing you want to understand about the operator sites is that they behave cooperatively.

The promoter PR does not require a transcriptional activator to turn on. However, it can be repressed by a protein that should be familiar to you from last time, the lambda repressor that is encoded by the cI gene. Repressor has about a ten-fold higher affinity for OR1 than for OR2, but once the former is bound, the latter's affinity increases. In fact, the attractive physical interaction between two repressor proteins results in their nearly concurrent binding at the two operator sites.
By now, your reading about promoters (and operators) — both general and specific to λ and lux — should enable you to develop a modification to Plux-λ that reduces its leakiness and thereby improves the edge detector.

As a practical matter, you also want to understand a bit about restriction enzymes today. Also called restriction endonucleases, these proteins cut (“digest”) DNA at specific sequences of bases. The restriction enzymes are named for the prokaryotic organism from which they were isolated. For example, the restriction endonuclease EcoRI (pronounced “echo-are-one”) was originally isolated from E. coli giving it the “Eco” part of the name. “RI” indicates the particular version on the E. coli strain (RY13) and the fact that it was the first restriction enzyme isolated from this strain.
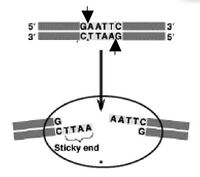
The sequence of DNA that is bound and cleaved by an endonuclease is called the recognition sequence or restriction site. These sequences are usually four or six base pairs long and palindromic, that is, they read the same 5’ to 3’ on the top and bottom strand of DNA. For example, the recognition sequence for EcoRI (see also figure at right) is
5’ GAATTC 3’
3’ CTTAAG 5’

Unlike EcoRI, some other restriction enzymes cut precisely in the middle of the palindromic DNA sequence, thus leaving no overhangs after digestion. The single-stranded overhangs resulting from DNA digestion by enzymes such as EcoRI are called sticky ends, while double-stranded ends resulting from digestion by enzymes such as HaeIII are called blunt ends. HaeIII recognizes
5’ GGCC 3’
3’ CCGG 5’
Protocols
Part 1: Complete DNA design
For homework you were asked to think about what feature(s) of Plux-λ (at least the version of this hybrid promoter present in the edge detector) might be causing its suboptimal behavior. Now is your chance to fix it, by specifying mutations, deletions, and/or additions to the sequence. We have built a version of the IPTG-sensitive pseudo-edge detector with restriction sites directly bracketing Plux-λ, thus allowing the faulty part to be readily swapped out with a modified version.
You are welcome to make as subtle or drastic a change as you wish to reduce the promoter's leakiness. We hope to see a variety of solutions implemented by the class at large, so do post your ideas on the Talk page and consider changing your design if it is identical to another group's.
You will implement your design by specifying two synthetic oligonucleotides — a top strand and a bottom strand — that can be annealed together and then ligated directly into a digested pED-IPTG-INS backbone. (Where ED indicates pseudo-edge detector, IPTG the molecule that it is sensitive to, and INS the fact that Plux-λ variants can readily be inserted into the vector.)
- Begin by copying the Plux-λ sequence into a Word document.
- Underline the lambda operators and the lux box, and mark the -10 and -35 regions in bold.
- Make a copy of the annotated Plux-λ sequence below the original, and modify the sequence to reflect your design. Indicate which are the 5' and 3' ends.
- Now get the complement of this strand (for example, using this website) and mark its 5' and 3' ends as well.
- Within the backbone, the restriction sites bracketing Plux-λ are XmaI at the 5' end and BamHI at the 3' end. Add the appropriate restriction overhangs to each of your strands such that they will be ligated into your backbone without digestion.
- It's perhaps easiest to check that you are doing this correctly by writing out a bit of the backbone sequence before and after digestion (by hand), doing the same for the insert, and making sure that they will fit together.
- A great resource for information about restriction enzymes is the NEB website. You can begin at at Technical Reference → Enzyme Finder.
- For ordering purposes, DNA should always be written 5' to 3'. Add your two sequences to the Day 2 Talk page in this format, and also hand in a copy of your design document when you are done with it. Paste a second completed copy in your notebook.
- Write a 1-3 sentence description of your design rationale, both in the document and on the Talk page table.
Part 2: Test liquid cultures for β-gal production
With this assay you will determine the amount of beta-galactosidase activity associated with your cultures from last time. A table is included here to help you organize your assay, but you can make one of your own if you prefer.
When you first try this assay you may find 15 second intervals too fast, and when you are expert at it you may find them too slow. Somewhere between 10 and 20 seconds should be a good time interval to shoot for.
The sample order below is recommended in order to minimize the risk of saturating samples expected to produce a lot of β-gal ("neg" means no additives). When you first try this assay you are almost certain to incubate some samples too long. Remember that you are shooting for a subtle rather than a bright yellow.
| Tube # | Sample | OD600 | Time started | Time stopped | Time elapsed (calculated) | OD420 | OD550 | Units (calculated) |
|---|---|---|---|---|---|---|---|---|
| 0 | blank | 0:00 | ||||||
| 1 | IPTG-1 | 0:15 | ||||||
| 2 | IPTG-2 | 0:30 | ||||||
| 3 | IPTG/AHL-1 | 0:45 | ||||||
| 4 | IPTG/AHL-2 | 1:00 | ||||||
| 5 | neg-1 | 1:15 | ||||||
| 6 | neg-2 | 1:30 | ||||||
| 7 | AHL-1 | 1:45 | ||||||
| 8 | AHL-2 | 2:00 |
- Retrieve the cultures that you prepared last time, and prepare 1 mL of a 1:10 dilution of each one in Zbuffer.
- Use 0.6 mL of the dilution to measure the OD600 for each sample.
- Save the rest for the β-gal assay.
- Add 450 μl of Zbuffer to 9 eppendorf tubes labeled 0-8.
- Add 50 μl of the diluted cells to each tube. See chart above for guidance. Add 50 ul of Zbuffer to tube 0, to serve as your blank.
- Next you will lyse the cells by add 20 μl of 0.1% SDS to each eppendorf.
- To more fully lyse the cells, you should also add 30 μl of chloroform (CHCl3) to each tube. Do this in the hood since chloroform is volatile and toxic.
- You will need to hold the pipet tip close to the eppendorf as you move between the chloroform stock bottle and your eppendorfs since chloroform has a low surface tension and will drip from your pipetmen. Be sure to dispose of your pipet tips in the chloroform waste container located on the right side of the hood.
- To complete the cell lysis, vortex the tubes for 10 seconds each. You should time these precisely since you want the replicates to be treated as identically as possible.
- You should be able to fit 2-3 tubes on the vortex at once.
- Start the reactions by adding 100 μL of ONPG to each tube at 10 second intervals (or whatever Δ t you have chosen), including your blank. Invert to mix.
- Stop the reactions by adding 250 μL of Na2CO3 to each tube once sufficient yellow color has developed.
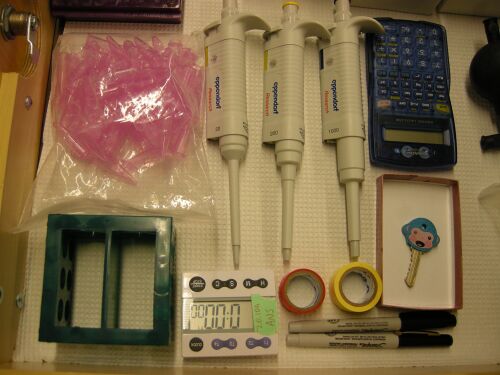
- “Sufficient” is defined as yellow enough to give a reliable reading in the spectrophotometer, best between 0.3 and 1.0. It is about the amount of yellow color that you see for the yellow tips for your P200. Keep in mind, though, that adding Na2CO3 makes the reactions more yellow!
- Try to stop the duplicate reactions at equal intervals and be sure to note the time you are stopping the reactions.
- When all your samples have been stopped, add 250 μL of Na2CO3 to the blank and spin all the tubes in the microfuge for 1 minute at 13,000 RPM to pellet any cell debris.
You have two options for completing the assay, described below.
Measurement Option 1
- Move 0.7 ml of each reaction to plastic cuvettes.
- Avoid the chloroform that will be at the bottom of your tubes. If you add the chloroform to the cuvettes, it will "etch" the cuvette windows and mess up your readings.
- Read the absorbance at 420nm. These values reflect the amount of yellow color in each tube.
- Read the absorbance of each at 550 nm. These values reflect the amount of cell debris and differences in the plastic cuvettes themselves.
Measurement Option 2
- Move 0.2 ml of each reaction to a 96-well plate.
- Avoid the chloroform that will be at the bottom of your tubes.
- Go to BPEC with a member of the teaching faculty to automatically read your samples at 420 and 550 nm.
- Be sure to bring your USB key so you can retrieve your data immediately.
Dispose of your samples properly: liquid contents of cuvettes/microplates (but not eppendorf tubes!) can go down the sink, empty cuvettes can go in the sharps containers, and CHCl3 (along with the other contents of your eppendorf tubes) can go into a waste bottle in the hood.
For homework you will convert the absorbances to enzyme activity, or Miller units.
Part 3: Observe solid cultures
Briefly take a look at your plate and comment on it in your notebook. How well can you detect an edge? Which parts of the plate have the highest background, those that were in the dark or those that were in the light? Are these results consistent with what you expect? Be sure to also look at and comment on the plate prepared by the TA.
For next time
- Calculate the Miller units (described below) for each sample that you assayed today. Prepare a bar graph of your results, with a figure caption.
- You can average the duplicate values for each sample unless you know of a reason not to (e.g. one tube spilled or had the incorrect amount of something added to it...)
- You should use error bars to indicate the range of/scatter in your samples, when you do average the duplicates.
Typically β-gal activity is reported in "Miller Units" according to the following formula:
1 Miller Unit = [math]\displaystyle{ 1000 * \frac{(Abs{420} - (1.75*Abs{550}))}{(t * v * OD{600})} }[/math]
where:
Abs 420 is a measure of the yellow color produced by the β-gal activity.
Abs 550 is a measure of cell debris.
OD 600 is a measure of the cell density.
t is the reaction time from start to stop, measured in minutes.
v is the culture volume that you added to the reactions, measured in mLs (remember to account for dilution).
Reagent list
- Z-buffer
- 0.06 M Na2HPO4
- 0.04 M NaH2PO4*H2O
- 0.001 M KCl
- 0.0001 M MgSO4
- 0.1 % sodium dodecyl sulfate (SDS)
- 4 mg/ml ONPG in Z-buffer
- 1M Na2CO3
