\Standard Curves for New Nanodrop
The good people at Thermo Scientific fixed the nanodrop in next to no time and shipped it back to us today! It works wonderfully now. I made a standard curve, which will hopefully be the last for awhile.
For the standard curve I used my new made-in-lab phosphate statdard (1mM monopotassium phosphate). I made sixteen cuvettes with the following concentrations
- 0 uM (Blank)
- 12.5 uM (0.5 uL)
- 18.75 uM (0.75 uL)
- 25 uM (1 uL)
- 31.25 uM (1.25 uL)
- 37.5 uM (1.5 uL)
- 43.75 uM (1.75 uL)
- 50 uM(2 uL)
- 100 uM (4 uL)
- 150 uM (6 uL)
- 250 uM (10 uL)
- 375 uM (15 uL)
- 500 uM (20 uL)
- 625 uM (25 uL)
- 750 uM (30 uL)
- 1000 uM (40 uL)
I pipetted the phosphate standard into the cuvettes, and then added enough Di H20 to bring the total volume up to 40 uL. I then added 200 uL of 0.6 M perchloric acid (quencher) to each cuvette, then 0.6 mM of the malachite green dye (developer). I set to Nanodrop to read the absorbance at 640, 645, 650, 655, and 660 nm wavelengths. I did all of the following analysis using the data collected at 650 as it is re recommended wavelength at which to measure. I do have the data for the other wavelengths saved in case there is any need for it in the future.
In July I made several measurements in order to determine the developing time of the malachite green dye. I found that at the 10 minute recommendation given by Cytoskeleton, the dye is still developing pretty rapidly, so even being a few seconds off could produce discrepancies between the data points. I did find that at fourteen minutes the developing rate slows almost to zero, so I figured that making measurements at 16 minutes would ensure that the dye had fully developed and there would be less error in the absorptions. Cytoskeleton does warn against this as for high concentrations there is a fallout in the solution. However, in the future I will be focusing on small concentrations, so the risk of fallout is very low.
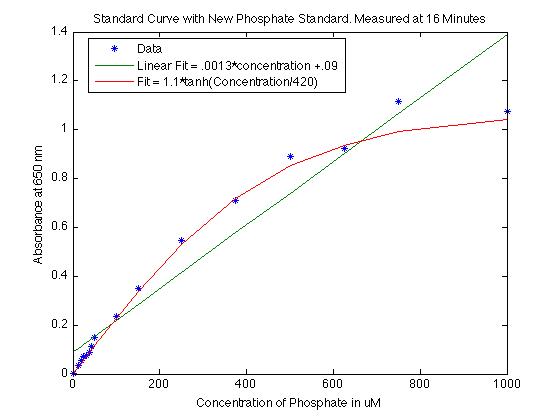
From previous standard curves I noticed that there is a curvature that is pretty poorly estimated by a linear fit. I thought that it looked a bit like a hyperbolic tangent functions, so I played around with graphing the hyperbolic tangent function with various coefficients of the concentrations. I found the curve that best fit this specific data was
- absorption = 1.1 x tanh(concentration/420)
While a linear fit gave:
- absorption = 0.0013 x concentration + 0.09
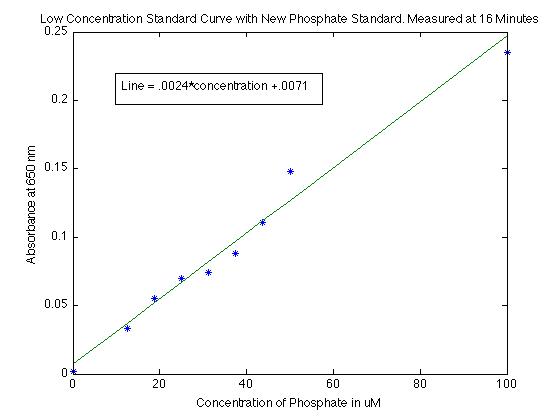
As I mentioned though, I will in the future be dealing with low concentrations of phosphate, probably between 0 to 100 uM. I made several measurements for lower concentrations so that the measurements are clearer. I did find that for low concentrations (less than 100 uM) the absorption is pretty linear fit by
- absorption = .0024 x concentration +.0071
I did have a though about how the entire standard curve is not linear. I have been unable to come up with a good reason, but I think it may be because of fallout in the solution. When a cuvette is left to sit for 20 minutes or so (or if there is just a very high concentration), there are chunks that form in the bottom that do not easily go back into solution. I think the curvature could be explained by this fallout. All the malachite green has fallen to the bottom at large concentrations and even when shook just before measurement, it is possible that the fallout does not go back into solution, falls below the measurement area, and thus we read a lower absorbance value than we ought to. This may not be the real reason, but it was a thought that I didn't want to forget!
Also, we do have the CytoPhos assay from Cytoskeleton that I have not yet used. Apparently it can detect lower concentrations of phosphate better than the PhosFree assay that we have been using. I think it may be wise to do a quick standard curve with this assay in the near future, as it may give better results when we start trying to use the assay to measure kinesin activity.

