User:Steven J. Koch/Notebook/Kochlab/2009/07/10/More calibration
Steve Koch 23:47, 10 July 2009 (EDT): Increased laser power to 11.92 Amps. However, can only get power controller to go up to 687.8 W. I wonder if that means I need to switch the ND? Did a power spectrum (data file 27), and it didn't look too bad. Got consistent corner frequency of about 2,140 Hz. This would be 0.13 pN / nm. Or, about 0.19 pN / nm / Watt. This is still about 8 times less than the about 1 pN / nm / W we're looking for (and for a smaller bead, also).
- Andy Maloney 00:21, 11 July 2009 (EDT): How does these numbers scale for smaller beads?
- 03:50, 11 July 2009 (EDT): It's hard to say (since bead is comparable size to spot) -- but I would have expected at least linear with radius. Maybe not, though.
Repeated it, and this time tried to put the bead 2 microns above the surface (using scope tick marks, and fact that bead goes out of focus when pushed against cover glass). (Needed to disable the FreshPhotonics scaling in the power spectrum program). Got a value of 2,400 and then 2182. and then 1983.
Beam expander to "40"
- bead seemed less stable, but first corner frequency was 2735. second (after increasing digitization) was 2107.
Beam expander to "20"
- first corner 2676, second 2654
Beam expander to "0"
- bead disappears
New bead, back to "60"
- first PS: 2212; then 2196
moved to "100"
- 1705; 1704
moved to "90"
- 1776; 1745
moved to "80"
- 1733; 1674
moved to "70"
- 1805; 1837 (bad); 1865
moved back to "60"
- 2040; 1542 (BAD)
moved to 70, then back to "65"
- 1519
moved to 55
- 1565
This method sucks! Going to try viscous method
Sine wave viscous drag
same bead, same power. sine wave 20 Hz, 400 mV amplitude. Looking at X on scope.
- beam expander 55
- 296 mV peak to peak
- beam expander to 80 (note: the x average changed substantially (about 600 mV)
- same peak to peak, maybe a bit less, hard to say,
- using 16 averages and "measure": 220 mV +/- 4 mV
- beam expander to 100
- using 16 averages: 188 +/- 4 mV
- beam expander to 120
- 168 +/- 8 mV
- bead focus is substantially different, though...maybe detector is all sorts of different?
- back to 60
- 192 +/- 4 mV
- to 50
- 192 +/- 8 mV
- to 40
- 216 +/- 8
(After the above data, I figured out it was dumb to trigger off the X signal, and instead triggered off the piezo sensor. This made the averaging much more reliable. I took some measurements in this excel file: File:090710 Viscous drag beam expander studies.xls

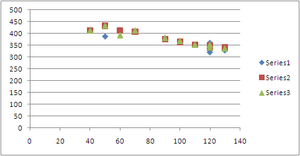
For all of these, I tried to make the bead the same height above the surface, judged by when the bead hit the surface. The data would indicate that the stiffness steadily increases for more and more beam expansion. However the other test (power spectrum) would indicate higher stiffness for lower beam expander. At this point, I trust the power spectrum more.
