User:Rebeca Rodriguez/Notebook/Chem 471/2015/09/23
ObjectiveCalibration curve for Bradford Assay + lysozyme ProtocolInstructions taken from Dr. Hartings. The basic protocol that we will be using for this procedure can be found here. (*Note: use section 2.3, page 5)
Sample PreparationTo make the stock solution, 10.1 mg Lysozyme was added to a 5 mL volumetric flask. The volumetric flask was then filled to the line with buffer solution (50 mM Tris 50 mM NaCl pH 7.5). The final stock solution had a concentration of 2020 μg/mL. -- Made by Michael.
The second round of standard solutions were prepared using the volumes of solution found below. The solutions described below used 1:4 diluted Bradford reagent resulting in brilliant blue solutions which become darker with increased protein concentration.
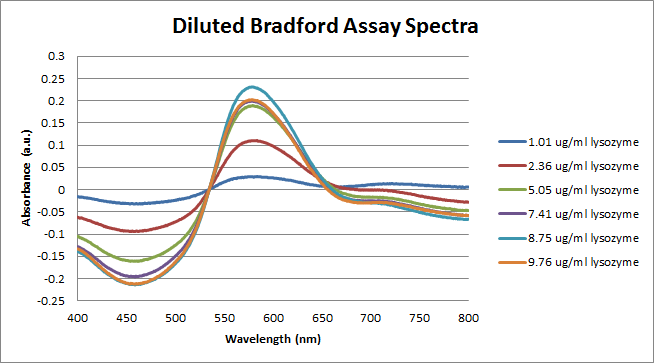
ResultsData and Analysis taken from Michael, he started all of the data before I got there. Figure 1: The figure above shows the UV-Vis spectra of the Bradford solution mixed with varying concentrations of lysozyme. Figure 2: The figure above is a calibration curve for the concentration of lysozyme using a Bradford Assay constructed from the spectra in Figure 1. It is clear that something went wrong with this experiment because there should be a linear relationship between concentration and absorbance at λ = 600 nm. The extinction coefficient for Bradford bound to lysozyme at λ = 600 nm, according to this graph, is ε = 0.0231 mL·μg-1·cm-1. Figure 3: The figure above shows the UV-Vis spectra of the diluted Bradford solution mixed with varying concentrations of lysozyme. Figure 4: The figure above is a calibration curve for the concentration of lysozyme using a diluted Bradford Assay constructed from the spectra in Figure 3. It is clear that something went wrong with this experiment because there should be a linear relationship between concentration and absorbance at λ = 600 nm. The extinction coefficient for Bradford bound to lysozyme at λ = 600 nm, according to this graph, is ε = 0.0224 mL·μg-1·cm-1. NotesIt was noted that during the second round of Bradford analysis of lysozyme using the diluted Bradford reagent, particles were observed floating in the higher concentration lysozyme samples. This suggests that the lysozyme crashed out of solution before the UV-Vis spectra were taken. This could explain why a linear relationship was not observed. The calibration curve should be remade. Perhaps the solutions were prepared and left to sit too long prior to analysis with UV-Vis. | |||||||||||||||||||||||||||||||||||||||||||||||||||||||||||||||||


