UV-Vis 2016831
Solution Preparation
0 mM Fructose
| pH
|
μL of 1 mM HClstock
|
μL of 1 mM NaOHstock
|
μL of 1 M NaOHstock
|
μL of AuCl3stock
|
μL of Fructosestock
|
μL of BSAstock
|
μL of Water
|
| 4 |
500 |
0 |
0 |
374 |
0 |
460 |
3666
|
| 5 |
50 |
0 |
0 |
374 |
0 |
460 |
4116
|
| 6 |
5 |
0 |
0 |
374 |
0 |
460 |
4161
|
| 7 |
0 |
0 |
0 |
374 |
0 |
460 |
4166
|
| 8 |
0 |
5 |
0 |
374 |
0 |
460 |
4161
|
| 9 |
0 |
50 |
0 |
374 |
0 |
460 |
4116
|
| 10 |
0 |
500 |
0 |
374 |
0 |
460 |
3666
|
| 11 |
0 |
0 |
5 |
374 |
0 |
460 |
4161
|
| 12 |
0 |
0 |
50 |
374 |
0 |
460 |
4116
|
0.0625 mM Fructose
| pH
|
μL of 1 mM HClstock
|
μL of 1 mM NaOHstock
|
μL of 1 M NaOHstock
|
μL of AuCl3stock
|
μL of Fructosestock
|
μL of BSAstock
|
μL of Water
|
| 4 |
500 |
0 |
0 |
374 |
24 |
460 |
3642
|
| 5 |
50 |
0 |
0 |
374 |
24 |
460 |
4092
|
| 6 |
5 |
0 |
0 |
374 |
24 |
460 |
4137
|
| 7 |
0 |
0 |
0 |
374 |
24 |
460 |
4142
|
| 8 |
0 |
5 |
0 |
374 |
24 |
460 |
4137
|
| 9 |
0 |
50 |
0 |
374 |
24 |
460 |
4092
|
| 10 |
0 |
500 |
0 |
374 |
24 |
460 |
3642
|
| 11 |
0 |
0 |
5 |
374 |
24 |
460 |
4137
|
| 12 |
0 |
0 |
50 |
374 |
24 |
460 |
4092
|
UV-Vis Measurement: Gold Concentration=0.25 mM
| [Fructose]
|
pH 4
|
pH 5
|
pH 6
|
pH 7
|
pH 8
|
pH 9
|
pH 10
|
pH 11
|
pH 12
|
| 0 mM |
X |
X |
X |
X |
X |
X |
X |
X |
X
|
| 0.0625 mM |
X |
X |
X |
|
X |
X |
X |
X |
X
|
Protocol
All solutions were prepared by Dr. Hartings
- If Necessary
- Turn on the instrument (if not already done)
- Turn on the computer (if not already done)
- Open the UVProbe software
- Get the computer talking to the instrument by clicking the "Connect Button"
- Set the measurement "Method"
- Click the icon, at the top, that is a yellow circle with a green "M"
- Set the wavelength endpoints
- Typical for our measurements are: 200 nm to 800 nm
- Set the spectrum resolution
- Typical for our measurements is 1 nm
- Set the acquisition speed/quality
- Typical for our measurements is Medium
- Set the data collection pathway and the name for the file that will contain every spectrum collected
- Change the directory to: C:\Users\Chem Lab\DropBox\CHEM471 2016\UV Vis\Year\Month\Date
- Set the filename to something descriptive for all of the samples to be collected
- Baseline the detector
- Option A
- Fill the cuvette you will use for the rest of the measurements with the solvent that suspends your analyte
- Place the cuvette in the proper holder in the instrument, making sure that light will pass through 2 clear windows
- Click "Baseline"
- Option B
- Don't place a cuvette in the holder at all
- Going this route will require you to take a spectrum of your solvent as a blank. You will have to correct all of your subsequent spectra for your solvent's spectrum. This is the best option when there are multiple users on the same instrument during a single day
- Click "Baseline"
- Collect data
- Place a sample in a properly cleaned cuvette
- Place the cuvette in the proper holder making sure that light will pass through two transparent cuvette windows
- Click "Start"
- Saving data
- When the spectrum has been acquired and the instrument has reset itself to its "start" position, you can save your data.
- Save data in a format readable by the instrument (.spc files)
- From the Menu, select "File > Save As"
- Give your file a name that is representative of that particular sample (include descriptors for identity, concentration, or any other important variable)
- Click "Save"
- Save data in a format readable by analysis software on your computer (.txt files)
- From the Menu, select "File > Save As"
- Change "Save as type" to "Data Print Table"
- Your filename from the previous step will be conserved. Only the file extension will change.
- Click Save
- Repeat as necessary
- Shutting down the instrument
- Click the "Disconnect" button at the bottom of the screen
- Close out of the software (if at the end of the day)
- Shut down the computer (if at the end of the day)
- Open the "Q Blue Wireless Temperature Controller" by clicking its icon on the desktop
- Set the Temperature
- Set the Control Status to "On"
- Input your desired temperature
- Click "Change" for the Target Temperature and type in the temperature you want for the experiment
- For most nanoparticle syntheses, the temperature is 80C
- Set the stirring
- If you need stirring, and have a stir bar in your cuvette, set the stirrer to "On"
Objective
The objective of this laboratory was to measure the concentration of gold nano-particles in solutions. The solutions tested had varying pH and fructose concentration. The purpose of this laboratory was to find which combination of pH and Fructose concentration would yield the highest gold nano-particle concentration. In order to determine concentration, the absorbance of each solution was measured. The solutions with higher absorbance will be deemed to have a higher concentration of gold nano-particles.
Notes and Observations
All test solutions were a uniform purple tinge with the exception of the 11 pH and 12 pH tubes for both concentrations of Fructose. The 11 and 12 pH tubes were both uniformly clear. There was no visible difference in the coloration of the purple tubes, as well as the clear 11 and 12 pH tubes. The 7 pH 0.0625 mM Fructose tube had a pipetting error during preparation, and formed fibers. The fibers were a dark purple color, while the rest of the solution was clear. This tube was not used.

This graph details the absorbance of the 0 mM Fructose sample when wavelengths of 800 nm to 200 nm were run through the sample. pH 7 appears to have the highest absorbance. This graph was the correction, as the samples in this graph have a more common origin than the uncorrected graph, which can be viewed in 3 figures.

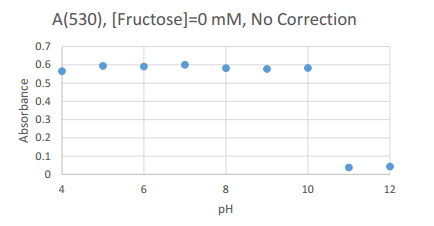
This graph details the peak absorbance experienced by the 0 mM Fructose samples. The common wavelength used (as it was the peak wavelength for all samples) was 530 nm.
0 mM Fructose
| Wavelength
|
pH 4
|
pH 5
|
pH 6
|
pH 7
|
pH 8
|
pH 9
|
pH 10
|
pH 11
|
pH 12
|
| 530 |
0.565 |
0.594 |
0.591 |
0.6 |
0.582 |
0.578 |
0.583 |
0.038 |
0.43
|
This table contains the values of peak absorption experienced by samples at 530 nm, and can be used as a reference for the scatter plot above.

These are the graphs obtained before the common origin was found and the data was corrected. It should be noted that the lack of a common origin created more discrepancies among the points in the graphs.

This graph details the absorbance of the 0,0625 mM Fructose sample when wavelengths of 800 nm to 200 nm were run through the sample. pH 9 and 10 appear to have the highest absorbance. This graph was the correction, as the samples in this graph have a more common origin than the uncorrected graph, which can be viewed in 3 figures.

This graph details the peak absorbance experienced by the 0 mM Fructose samples. The common wavelength used (as it was the peak wavelength for all samples) was 531 nm.
0 mM Fructose
| Wavelength
|
pH 4
|
pH 5
|
pH 6
|
pH 7
|
pH 8
|
pH 9
|
pH 10
|
pH 11
|
pH 12
|
| 531 |
0.599 |
0.592 |
0.593 |
N/A |
0.622 |
0.644 |
0.644 |
0.044 |
0.05
|
This table contains the values of peak absorption experienced by samples at 531 nm, and can be used as a reference for the scatter plot above.


These are the graphs obtained before the common origin was found and the data was corrected. It should be noted that the lack of a common origin created more discrepancies among the points in the graphs.
Analysis
The 0 mM Fructose solution experienced peak absorption at 530 nm. The 0.0625 mM Fructose solution was nearly identical, and experienced peak absorption at 531 nm.
All samples for both 0 mM Fructose and 0.0625 mM Fructose had concentrations of gold within them except for samples with pH of 11 and 12. Both sets of tubes from the 0 mM Fructose, as well as the 0.0625 mM Fructose with pH of 11 and 12 did not have gold in them, instead they were clear solutions which had developed dark purple fibers.
Not much is known why the gold nanoparticles are not observed in the samples with pH of 11 and 12. Perhaps the pH is too high to sustain the gold? Or perhaps the pH is so high that the proteins that are designated to cut the gold into nanoparticles have denatured, and thus cannot function.
Error
Potential sources of error, which could have caused minor discrepancies in the absorbance of each sample, stem from a number of different areas. The light which is beamed through the sample does not always have constant intensity for each trial, as was described by Dr. Hartings. After each sample was used, and placed back in its respective test tube, the cuvette was washed with water, a soap, and HCl, followed by more water. If there was excess liquid within the cuvette, this would dilute the sample, decreasing the concentration of the gold nanoparticles and thus decreasing absorption. The cuvettes also could have had varying finger prints on their surface from the group handling them before and after each trail.
| 


