User:Nuri Purswani/Network/Results/Network1
| Home | Introduction | Synthetic Datasets | Methods | Algorithms | Results | Discussion | References |
Network 1: Chain
The first network inference exercise consisted of a linear chain of genes, with a simple feedback loop, as shown in figure 1:

Figure 1: Network 1 - simple chain with feedback
We chose a simple example and sampled three different combinations of points in the network. Then we performed comparisons 1., 2. and 3. between the Bayesian Inference and the Robust control method.
Variation of signal to noise ratio for a fixed number of experiments
The conditions for this simulation were:
- Number of Experiments - Kept constant at N=3
- Step Input Perturbation - Applied to nodes 1,2 and 3 in turn
- Gaussian noise perturbation- Applied to all measurements, variation in variance.
Figure 3 shows an example of what the datasets that were input to the algorithm look like at high signal to noise ratio.
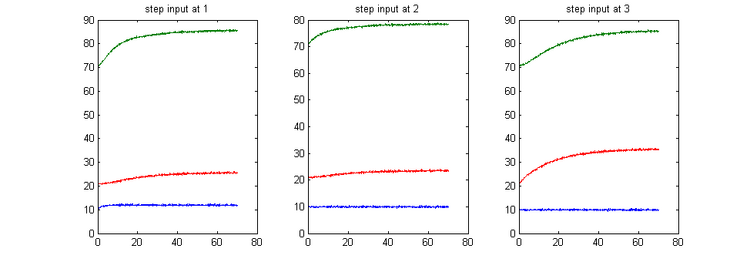
Figure 3: Experimental measurements after a step peturbation at every node, for an SNR of 57500, gaussian noise variance = 5e-7.
Important Note
The Robust Control Method and Beal's Algorithm take in different inputs (see Methods section), so by stating that this trial had N=3 experiments:
- Robust Control: For p=3 measurements and 3 input disturbances, each experiment contained 9 steady state measurements. So for N=3 experiments, the algorithm was given a total of 27 steady state measurements.
- Bayesian Method: For p=3 measurements and 3 input disturbances, this algorithm took in the time series of every experiment. In this particular case, we gave the algorithm 700 time points per trial (i.e. 2100 time points in total), although in practice it can recover network structure for lower numbers of time points. (Beal 2005, 2008).
Case 1: Measurements 1, 2, 3
When we sample the first three points, the true network we should recover is shown in figure 2.

Figure 2: Case 1 True network
Robust Control Method
For the highest signal to noise ratios (lower noise variances), the robust control method found the candidate structures in Figure 4:
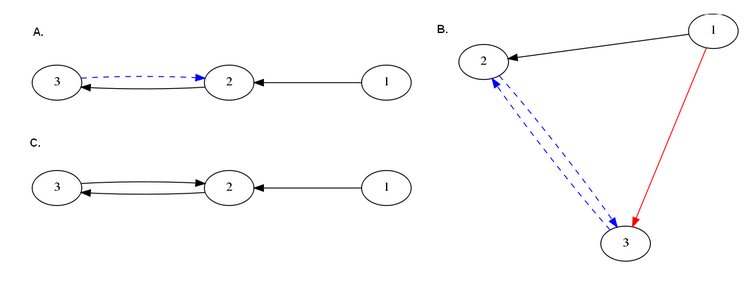
Figure 4:A.Best candidate structure. B. Second best candidate structure C. Third best candidate structure. For SNRs=57488 and 1885.The top three candidates were chosen, according to best AICc scores. The legend of arrows signifies the following:Black arrow: Correctly identified connection.Dashed blue arrow: False negative (missed connection)Red arrow: False positive (spurious connection)
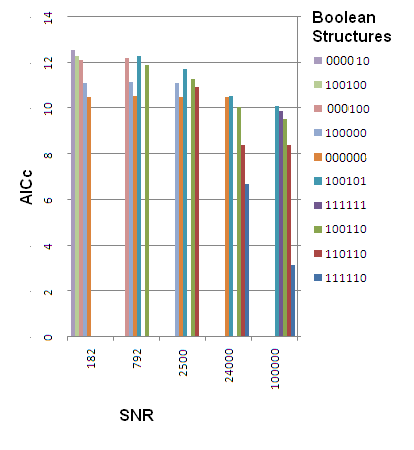
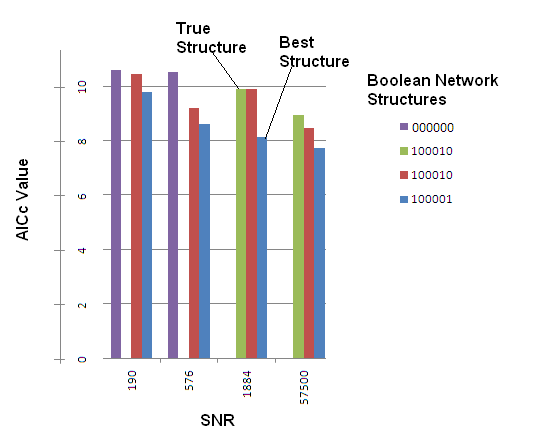
The best candidate structures were chosen to be those with the lowest AICc values. For detailed tables of AIC, BIC, AICc and Distance scores, follow this link:
In this particular trial, the Robust Control Method was capable of recovering the correct structure in the third highest AICc score for SNRs of 57488 and 1885. For lower SNR values, it did not succeed in recovering network structure.
Bayesian Method
This method returns different results depending on the confidence level.
Here we show results for z=3 and z=5 confidence levels. z=3 is neither too leninent nor too stringent. z=5 is the extreme (most stringent confidence level). As seen in methods, under the null hypothesis, CB+D=0, else there is a connection displayed as "significant".
57500, Noise Variance = 5e-7
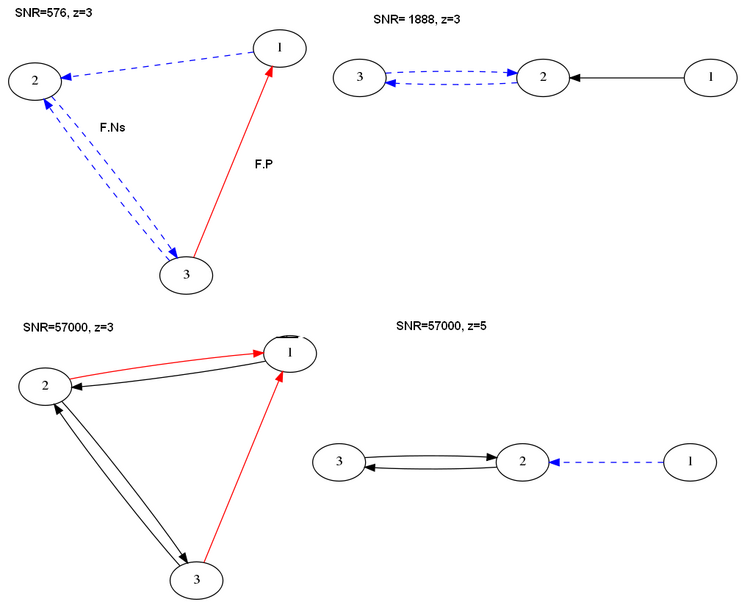 Figure: Results Bayesian Networks at different confidence levels
Case 2: Measurements 1, 2, 4
Robust Control Method
Variation of signal to noise ratio for a fixed number of experiments
For detailed results of the Robust Control Method in this case, follow this link. The conditions are the same as in section 2.1.2.
For the highest two values of signal to noise ratio used in this experiment, we obtained the networks below. This time, none of them recovered the correct answer, so we show the five best scoring structures, ranked again according to AICc:
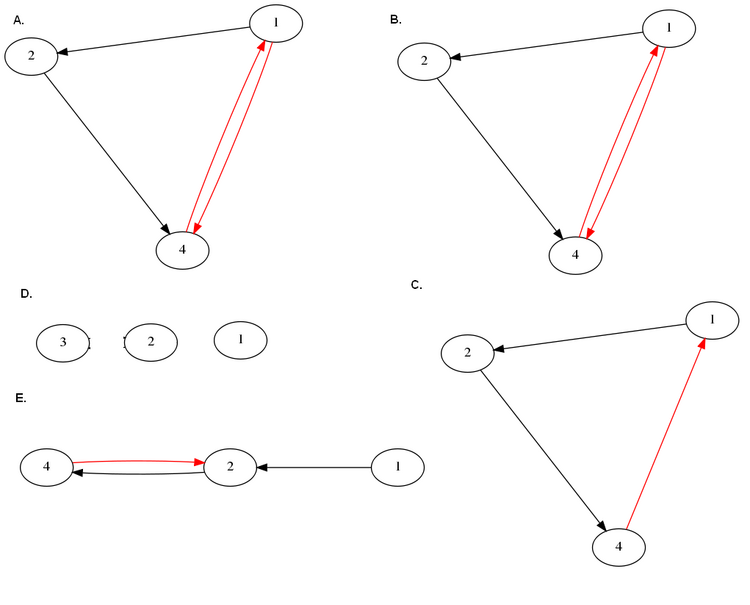 Figure :A.Best candidate structure. B. Second best candidate structure C. Third best candidate structure. D. 4th Best Candidate Structure E. 5th Best Candidate Structure For SNRs=1e5.The top five candidates were chosen, according to best AICc scores. The legend of arrows signifies the following:Black arrow: Correctly identified connection.Dashed blue arrow: False negative (missed connection)Red arrow: False positive (spurious connection)
