User:Matthew Whiteside/Notebook/Malaria Microarray/2009/07/15
Task 4.3: MAID meta-analysis of Human Malaria Microarray DatasetsMAID descriptionMAID paper:
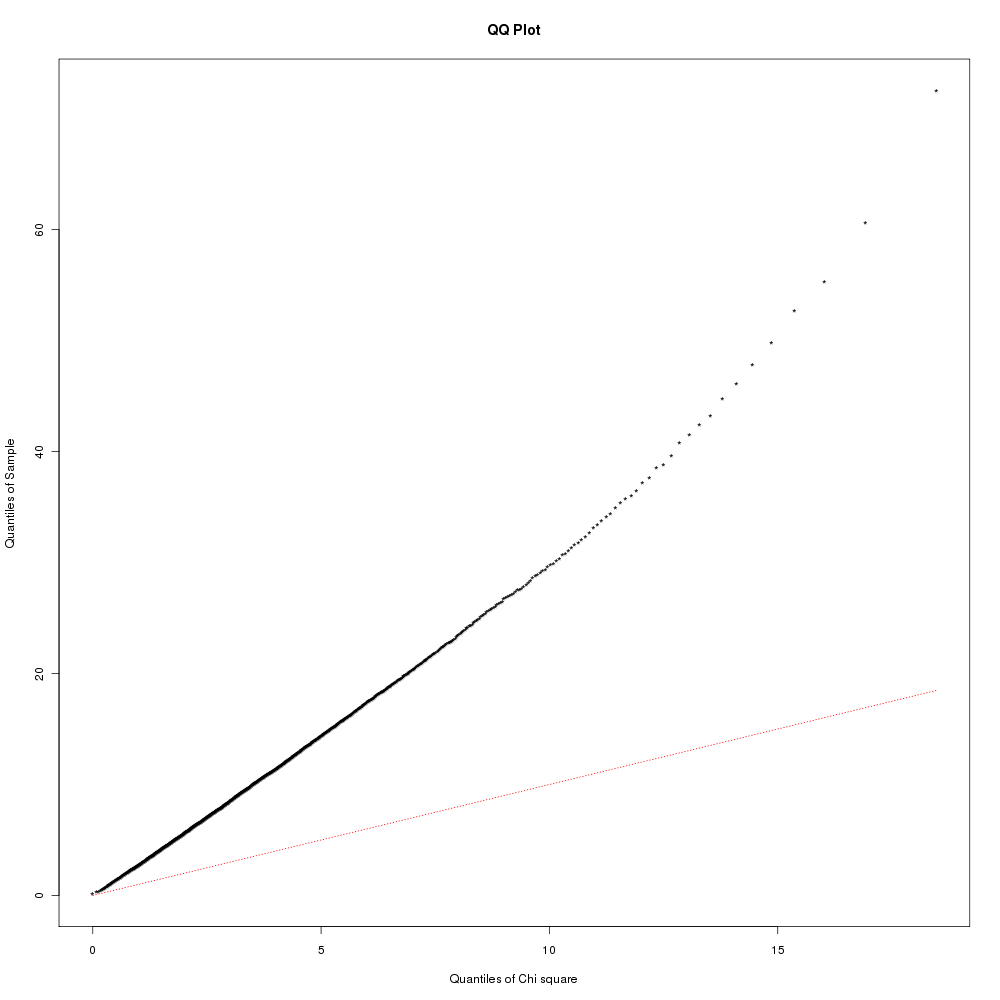
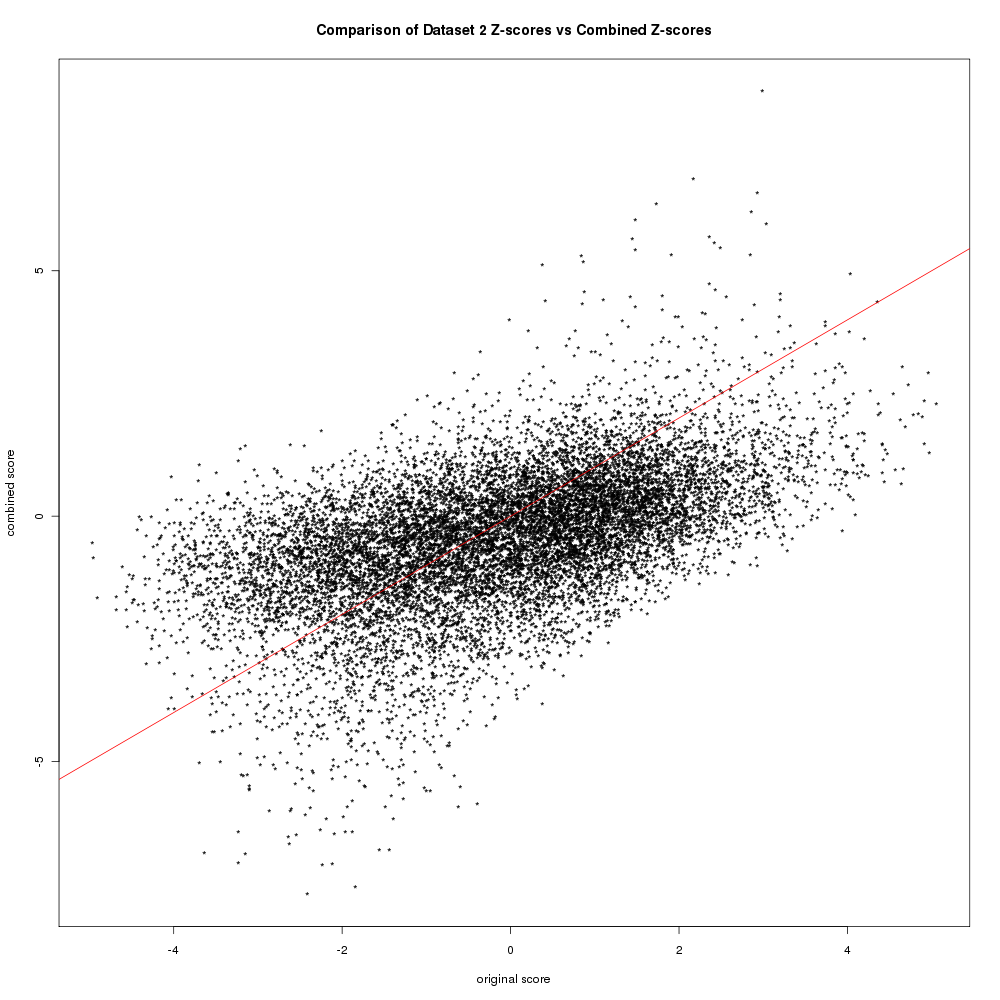
Meta-analysis: Increase in the sensitivity & reliability of gene expression measurements by integrating results from different microarray datasets that address similar questions Effect sizes: MAID uses effect sizes. Typical p-values represent the confidence that a observed relationship occurred by chance. Effect sizes measure the strength of the relationship (direction & magnitude of an effect). The effect size referred to here is the standardized measure of the differences in means between trmt & ctrl (see MAID paper). The benefit of MAID over GeneMeta is that it accommodates direct microarray designs (2-color arrays). Performing MAID meta-analysisAfter preparing the microarray data into a array-level expression matrix (link), used R script ~/.../meta_analysis/maid_de_workflow.R. Used the maid 1.0.1 bioconductor package provided by the authors. This uses old version of the exprSet objects - so i had to modify the code. ResultsArrays from contrasts: 1.1, 2.3, 3.1, 4.1, 5.1 were used in 1st meta-analysis. These microarray datasets come from very different tissues. DE genes916 genes were identified as being DE (FDR < 0.05) by the MAID meta-analysis, 150 up / 766 dn. All results are in dir: .../meta_analysis/de_genes/maid/. In MAID, either a FEM (fixed effects model) with no between study variation or a REM (random effects model) with between study variation is used (see MAID paper). To asses which model is appropriate - the hyp H0: τ2 = 0 is tested (τ2 between study variation). Q-statistic (eqn 10 in paper) ignores between study variability and will follow a Chi-sq distribution (with degree = number experiments - 1) if H0 is true. Q = Σ wj(γj - μFEM)2 γj is the observed effect size in study j and μFEM weighted least-sq mean: μFEM = Σ wj · γj ÷ wj Here is a histogram of the Q statistic values. Does it look like a Chi-sq? Here is a Q-Q plot of the observed Q-values & the expected Q-values from Chi-sq distribution. Are the observed close to the expected? Doesn't look like it. Based on those results i went with REM. One of the assumptions is that the transformed data (the effect size z-scores) are aproximately normal. To examine this i created a Q-Q normality plot with the REM model z-scores. Here is that figure. Is the data normal? MAID / GeneMeta also suggest plots to show the improvement in sensitivity & recall provided by the meta-analysis. The IDR (improved discovery rate) plot shows the proportion of additional z-scores above a threshold in the combined studies vs the individual studies (i.e. what proportion of predictions by the meta-analysis are unique to the meta-analysis and would not be found by doing individual analysis). There is a line for positive effect sizes and negative effect sizes. Here is the IDR plot: Here is a figure showing the combined and individual z-scores for contrast 2. You can see some changes (reversals of effect sizes), however there does appear to be an improvement in combined z-score for a select few of the genes - these will be the reinforced / highly-expressed genes found in other datasets. Lastly, this plot shows the number of genes that are above an FDR cutoff in an individual study or the combined meta-analysis. You can see that h1 & h4 generate more results than the combined TAKE HOME: The IDR is low and number of genes identified is also low relative to some of the datasets. The only benefit of meta-analysis here is generalization - common malaria genes that will be active in many tissues. There also may be problems with including this diverse of datasets - as the normality assumption may be violated. References:
ORAI ran GO term and pathway ora analysis (InnateDB) using the 916 genes identified from the meta-analysis. Results are in .../malaria_data/meta_analysis/ora/maid/. 764 pathways were found associated with genes. 0 were statistically significant after Benjamini-hochburg multiple hypothesis correction (FDR < 0.05). One reason for this - the genes identified by the meta-analysis were core, downstream genes; TNF, INF-gamma, STAT etc. These are in many pathways - so result in large numbers of predictions. The BH correction probably assumes 765 independent predictions were made - this is not true, since many of the predictions were dependent. This is similar for the 1761 GO terms. Another note: many of the pathways and GO terms associated with down-reg genes are core processes like transcription, translation etc. This is not surprising since infected cells will go into a state of cellular senescence. |
|


