July 2, 2013
FCS Sample Prep
- Green fluorescent beads
- 10000x diluted
- To be run 3x, 90s
- Oligo D
- 150, 125, 100pM
- To be run 3x, 300s (increase to 500s if noisey)
- DNA/MB
- 100/80, 75/60, 50/40pM
- Heated at ~70C for 25 min, cooled for at least 20 min
- To be run 3x, 500s (increase to 700s if noisey)
FCS Data
 <br.>
Beads used to align laser; three samples run at 90s each, average values used. Curve turned out as expected.<br.> <br.>
Beads used to align laser; three samples run at 90s each, average values used. Curve turned out as expected.<br.>
 <br.>
Oligo D: three samples run at each concentration, 500s each, average values used. Y-intercepts increase as concentration decreases, as expected.<br.> <br.>
Oligo D: three samples run at each concentration, 500s each, average values used. Y-intercepts increase as concentration decreases, as expected.<br.>
 <br.>
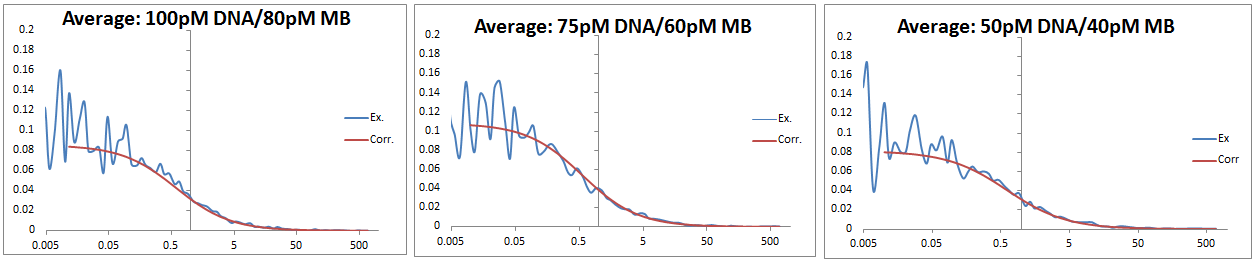
DNA/MB: three samples run at each concentration, 500s each, average values used. Y-intercepts increase as concentration decreases until 50pM. DNA in excess rather than MB to ensure binding.<br.> <br.>
DNA/MB: three samples run at each concentration, 500s each, average values used. Y-intercepts increase as concentration decreases until 50pM. DNA in excess rather than MB to ensure binding.<br.>
 <br.>
Calibration graphs for Oligo D and DNA/MB samples. Oligo D trend turned out as expected; DNA/MB trend dropped at 50pM concentration. DNA/MB samples will be remade and run again tomorrow. <br.> <br.>
Calibration graphs for Oligo D and DNA/MB samples. Oligo D trend turned out as expected; DNA/MB trend dropped at 50pM concentration. DNA/MB samples will be remade and run again tomorrow. <br.>
|


