User:Ginevra Cochran/Notebook/Physics 307L/Speed of Light lab
Purpose
SJK 12:17, 14 October 2010 (EDT)

Except for more detail needed on the measurement procedure, this is a very good primary notebook. There was sufficient detail for me to understand your analysis (and find some mistakes as described below) and understand your possible source of systematic error. That's all very good notebook practice! You can see how it would help you or another experimenter improve with the next attempt.
This lab's purpose was to measure the speed of light and compare it to the accepted value.
Equipment
SJK 12:10, 14 October 2010 (EDT)

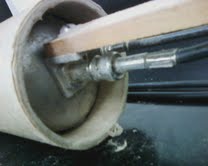
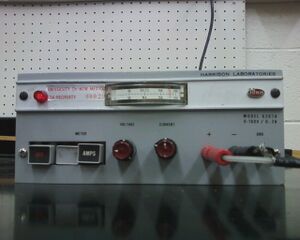
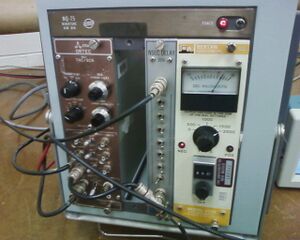
Good equipment list and nice photos
- Tektronix Oscilloscope - TDS 1002
- Bertan Power Supply - 215
- Canberra Delay Module - 2058
- Ortec TAC/SCA Module - 567
- Harshaw NIM Bin - NQ-75
- Harrison Laboratories Power Supply - 6207A
- Photomultiplier Tube PMT
- LED circuit
- BNC Cables
Safety
The main personal risk in this lab was electrical - we checked all cords for fraying and made sure the power supply was grounded. We also were careful not to expose the photomultiplier tube to direct light.
Setup
SJK 12:32, 14 October 2010 (EDT)

A little more details on the exact connections would be useful

I worked with Cristhian on this lab. We followed Professor Gold's manual and Alex Andrego's lab notebook.

The PMT was already inside the tube and attached to the delay module, and the LED was connected to the TAC and the Harrison power supply, as well as the oscilloscope.

We set the Bertan power supply to 2400 V, the Harrison power supply to 190 V,and the delay module to 32 ns. We set the TAC's range to 100 ns and its multiplier to 1. We set the output switch to out and the stop switch to anti.
Data
Analysis
Our measurement of the speed of light was obtained from the delay between the signals from the LED and PMT, which was converted to voltage. We took measurements of the delay voltage every 10 cm from 260 to 140 cm. At 260 cm, we twisted the PMT to maximize the calibration spike on the oscilloscope. Using the measure function on the oscilloscope, we recorded the height of the second signal, which represented the time-of-flight. Our calibration spike was adjusted at each increment, but basically seemed to stay at the same voltageSJK 11:51, 14 October 2010 (EDT)

A couple points here. First, your primary notebook could use more details here. What do you mean by "calibration spike?" I presume you mean the voltage signal from the PMT, but more description would help. How did you adjust the spike? Rotating the PMT is the preferred method, but did you do something else? Perhaps adjust the PMT high voltage? For reproducibility, this kind of information is necessary. Second, my guess is that you were a bit unsure of this process. Since you thought it basically remained the same, which it shouldn't, I'm guessing that here is the source of the very large systematic error. If you were to repeat the experiment, this is what we'd want to look at first
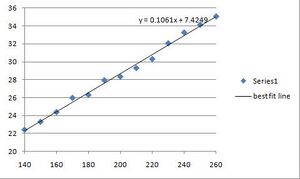
. We repeated this process 5 times, with Cristian recording trials 1 and 3 and me recording trials 2,4 and 5. The range setting on our TAC meant that our conversion factor was [math]\displaystyle{ 10 ns/V }[/math]. We averaged our voltages for each distance (column E) and converted these to time measurements using the TAC conversion factor given above. I then graphed these time measurements vs. distance and found a best-fit line using Excel

- the slope of this line was [math]\displaystyle{ .1061 ns/cm }[/math]. This slope is also calculated in cell H2 of the Google document above. Inverting this value gives the speed of light as [math]\displaystyle{ 9.43 cm/ns }[/math] (cell I9). Using Google Docs, I calculated the standard deviation (J2) and standard error of the mean (K2) of the set of time measurements (F2:14). I inverted this standard error of the mean and obtained an estimate of uncertainty for our speed of light value: SJK 12:06, 14 October 2010 (EDT)

This is a very good description of your analysis methods. Because it's good, I'm able to see that you didn't estimate your uncertainty correctly. What you want to do is get the standard error of the slope from the LINEST function. This is the value .00239, which is directly below the cell for your slope (.1061). We'll discuss this more in class when we derive the formulas for linear fitting, assuming normally distributed uncertainties on the y values. Once you have the correct standard error for the slope, you do not want to simply invert it. You want to do one of two things. One would be to approximate the uncertainty by putting the same fractional uncertainty on the speed as the slope has. That is, uncertainty on speed = speed * (stderr slope)/slope. The other way is as we discussed in class, calculate the inverse of (slope + stderr) and inverse of (slope - stderr).
- 9.43 ± 0.87 cm/ns.
The accepted value for the speed of light, according to Wikipedia, is
- 29.98 cm/ns.
Error
Error in this lab could have stemmed from the oscilloscope - the voltage measurement was hard to obtain because it fluctuated so much, even when we maximized the number of averages we were taking. Another major source of error was due to the calibration spike - I was not sure whether it should be set to a specific value or constantly set to its lowest possible value. We tried to maintain a calibration level of 1.57 V. This varying spike represented a varying amplitude in the light pulse, which caused a "time walk" which we may not have corrected for properly. Cristhian and I took turns reading the scope, and that also may have been a source of inconsistency between our sets of measurements. I do not feel that any of these sources account for the vast systematic error in our results, but I am at a loss to explain where it did come from, unless the setting on the delay module were incorrect.SJK 12:09, 14 October 2010 (EDT)

I am at a loss too. For sure the best thing to do here is to retake the data!
Sources
Cristhian was my lab partner for this lab. Professor Koch and Katie helped us figure out time walk and attempted to solve the myriad problems with our data. Brian explained how to obtain the voltage measurement from the oscilloscope and how to calibrate using the spike signal. I referenced Professor Gold's manual , Alex Andrego's lab notebook, and the Wikipedia articles on time walk and the speed of light.