User:Ginevra Cochran/Formal Report/Rough Draft
The Balmer series: Determining the Rydberg constant for hydrogen and deuterium
SJK 22:52, 17 November 2010 (EST)

Good title, author and contact info.
Experimentalists: Ginevra Cochran and Cristhian Carrillo
Junior Lab, Department of Physics & Astronomy, University of New Mexico
1919 Lomas Blvd NE
Albuquerque, NM 87131
serenity@unm.eduAbstract
SJK 22:58, 17 November 2010 (EST)

This is a good abstract. Some issues: First, there are too many digits on your values and uncertainties. In general only one digit is needed for the uncertainty, sometimes two if it's a low number. In your case, I would write (1.091 +/- 0.007) *10^7 1/m ... or you can say 1.091(7) * 10^7 1/m.
Second, It's good that you end with a conclusion. However, I'm not sure I'll agree with the conclusion, especially once you correct your mistake below in calculating the accepted value. It's likely that you will have systematic error, because your measurements are so precise, you can see tiny systematic errors. Also, it's likely you cannot distinguish between H and D with statistical significance. This latter issue you can explore during your extra data week. What are ways you can approach the question: "Can you tell H and D apart with your instrumentation?"
The Balmer series is the set of spectral lines produced by the transition of orbital electrons to the second energy level from above it. The Rydberg constant, the most precisely measured quantity in quantum mechanics, can be determined from the wavelengths of these spectral lines. We measured these wavelengths using a constant-deviation spectrometer and obtained a Rydberg constant for hydrogen of 1.0911685 +/- 0.0070852*107 1/m, with an error of 0.0863% from the accepted value for hydrogen. For deuterium, we obtained a Rydberg constant of 1.0991918 +/- 0.0018430*107 1/m, with an error of 0.795% from the accepted value for deuterium. From this, we concluded that our systematic error was minimized and that the Rydberg constant is dependent on the mass of the atom emitting light.
Introduction
SJK 22:17, 17 November 2010 (EST)

This introduction is far too short. In fact, your abstract has some very nice introduction material, more than this section. So, you will need to put a lot of work into expanding it. Often times, it will start out like the beginning of your abstract does, telling what it is we care about. Then, it is good to put in context of how the Rydberg or related constants have been measured. This where you would include your citations to prior peer-reviewed work. As noted below, you will need to have several of those, and this is the section where you would tend to put most of them. After setting the stage on what's been done, you can end by saying something like, "in this report we will ...." just a couple sentences that lead into the rest of the paper, which is all your work.
Johannes Rydberg, a Swedish physicist, presented the Rydberg formula in the 1880s as a relation between wavelength and differing integers.
- [math]\displaystyle{ \frac{1}{\lambda} = R_\infty \left(\frac{1}{n_1^2}-\frac{1}{n_2^2}\right) }[/math]
This relation was determined experimentally and predated the discovery of quantum mechanics. The Balmer series is the set of spectral lines produced by the Rydberg formula for n2=2.
- [math]\displaystyle{ \frac{1}{\lambda} = R_\infty \left(\frac{1}{n_1^2}-\frac{1}{4}\right) }[/math]
Hydrogen has four main spectral lines, and deuterium has three.
Methods
SJK 22:14, 17 November 2010 (EST)

The Methods section seems pretty good. I can easily follow what you did. Your figures and captions for figures 1-3 are good. I think good descriptions for the reader. If these images are from Alex, I think you should credit them in each photo, even linking to her original photos. I know you credit her below, which is great, but as you know, the reader may not look for that.
You will need some more figures. Ones showing the results. This will be for you to determine.
Also, your tables should have titles and descriptions too.
Also, when possible include the manufacturer name for the equipment.


Calibration of the constant-deviation spectrometer using mercury
SJK 23:10, 17 November 2010 (EST)

As I said, overall your methods seem very good. The method for converting data using the calibration is a bit unclear. If you use this method, you should show the calibration data and the fit. I think you'd find that a linear fit may not be the best idea. Furthermore, when you re-take data, you should adjust the crystal by hand to make the corrections as small as possible. Can discuss this in person.
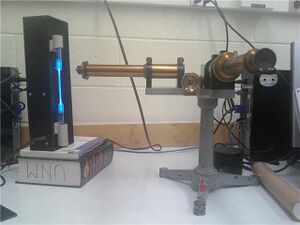
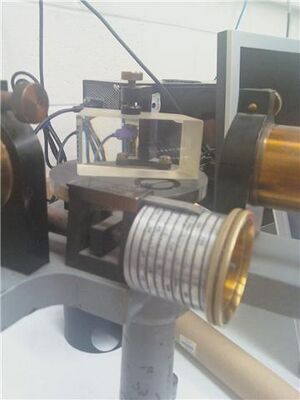
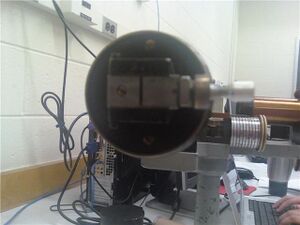
Before commencing our measurements, we adjusted the constant-deviation spectrometer (SER #12610) to suit the vision of the experimenters. We focused the cross-hairs by adjusting the position of the ocular and focused at the slit using the large knob near the center of the apparatus, eliminating parallax between the two. We elevated the spectrum tube power supply (Model SP200, 5000V, 10 mA) to align the narrow section of the our spectrum tubes with the slit which allowed light to enter the prism at the center of the constant-deviation spectrometer (see Figure 1). We slotted a mercury spectrum tube into the spectrum tube power supply. We switched on the spectrum tube power supply and allowed it to heat for 5 minutes. We opened the slit as wide as possible, focused on a red line, and narrowed the slit until the line was as sharp as possible without disappearing. We then set the constant-deviation spectrometer as far to the left of the spectrum as it would go, identified the spectral lines referred to in Table 1, and recorded the position noted on the screw drive (Figure 2).
Color Accepted Wavelength (nm) Recorded Wavelength (nm) Violet (very hard to see) 404.7 406.9 Violet 435.8 438.9 Weak Blue-Green skip this one n/a Green 546.1 553 Yellow 1 577.0 585.8 Yellow 2 579.0 588 Red 690.75 720
Using a linear fit in Google Docs, we found a best-fit line which we used to adjust our later measurements. This completed the calibration of the constant-deviation spectrometer.
Measurement of the Balmer spectrum of hydrogen and deuterium
We removed the mercury spectrum tube from the spectrum tube power supply and replaced it with a hydrogen spectrum tube. Moving the screw drive from left to right, we took 5 data points for each of hydrogen's 4 spectral lines (red, blue-green, and 2 violets). We then replaced the hydrogen tube with a deuterium spectrum tube. We were careful to turn the screw drive from left to right, recording 5 data points for each of deuterium's 3 spectral lines (red, blue-green, and violet).
Calculation of the Rydberg constant
We calculated our calibrated wavelengths for hydrogen and deuterium using the best-fit line we calculated from our efforts with the mercury spectrum tube. We averaged these calibrated wavelengths for each color and element and used Equation 1 to find the Rydberg constant for each average calibrated wavelength.
- Equation 1:
- [math]\displaystyle{ \frac{1}{\lambda }=R(\frac{1}{2^2}-\frac{1}{n^2}), n=3,4,5,6\,\! }[/math]
The Rydberg constant derived from quantum mechanics has the following formulation:
- [math]\displaystyle{ R=\frac{\mu e^4}{8\epsilon _0^2ch^3}\,\! }[/math]
- Where [math]\displaystyle{ \mu\,\! }[/math] is the reduced mass.
We calculated our percent error for hydrogen's and deuterium's Rydberg constants using this formula and the definition of percent error:
- [math]\displaystyle{ \% error=\frac{R_{accepted}-R_{measured}}{R_{accepted}} }[/math]
SJK 22:51, 17 November 2010 (EST)

You have an error in your calculation of the accepted values! I couldn't follow your formula too well in the excel sheet. But you only need to correct the infinite mass value by the reduced mass factor which is 1/(1+me/mnucleus). E.g., I get 1.0968E7 for hydrogen
Results
SJK 23:24, 17 November 2010 (EST)

This section is far too short. Often this section is called "results and discussion" (that's how I like to do it), but sometimes it's split into two sections, results followed by discussion. In any case, a lot of space in the paper is devoted to the results, which makes sense! I can see you would struggle a little because it seems you have reduced your data to a couple points. However, this will be remedied when you decide what figures to add into this section (as I mentioned above). Those figures will be pointed out and discussed in this section. For example, "Figure 4 shows our measured wavelengths versus starting quantum number for Hydrogen and Deuterium. The error bars represent the standard error of the mean of our five measurements. The expected values are shown as [whatever symbol]. We observed that [comment on what you see]."
Element Accepted Rydberg constant (1/m) Calculated average Rydberg constant (1/m) SEM of calculated constant percent error Hydrogen 1.0902269*107 1.0911685*107 0.0070852*107 0.0863% Deuterium 1.0905242*107 1.0991918*107 0.0018430*107 0.795%
Our raw data, initial calibration and calculations are visible here.
Conclusions
SJK 23:04, 17 November 2010 (EST)

As I note above in your abstract, I am not sure your conclusions are correct, since there is a mistake in the accepted values. Answering these questions (are H and D observably different? How much systematic error is there?) should be the focus when you take and analyze more data the final week. You can discuss with me how to approach this. In general, these kinds of conclusions are good. You can also talk about what could be addressed with future work.
The values we obtained in this experiment were very close to the accepted values, as seen in Table 2. Our systematic error for this experiment was thus very low compared to our random error. The Rydberg constants for hydrogen and for deuterium are slightly different, which is rooted in the fact that the calculated Rydberg constant is dependent on the mass of the atom.
Acknowledgments
SJK 21:27, 17 November 2010 (EST)

Good acknowledgements
I would like to thank my lab partner,Cristhian Carrillo, Katie Richardson, and Professor Koch for all their help in the execution of the lab, and Alex Andrego for the use of her photos documenting the experiment setup. We used Google Docs to calculate our results.
References
SJK 21:24, 17 November 2010 (EST)

For the final draft, you will need several references to peer-reviewed publications. It is definitely good to cite Gold's manual and other sources you use. But definitely peer-reviewed pubs need to be found and cited. The majority of these will be cited in your introduction, which you will have to expand a great deal as noted above. For example, "...one of the early measurements of the Rydberg constant for hydrogen and deuterium was provided by Drinkwater et al [1] and was ___." That's just an example. These papers can be very difficult to read. You don't need to understand the entire paper to cite it. But you do need to understand the part you're citing. This particular paper can be found via JSTOR here: http://www.jstor.org/pss/97359 You can access the whole article online. You can find potential papers to read by going to NIST CODATA and searching for keywords in the bibliography search: http://physics.nist.gov/cuu/Constants/Citations/Search.html
Overall SJK Comments
23:29, 17 November 2010 (EST): This is a good start! You can see the numerous things you'll need to fix in the margins above. It will seem like a lot, and it is, but it's all do-able. The biggest things are the Introduction and lack of citations of peer-reviewed reports, and the Results, where more figures and discussion are needed. There's also the issue where I think there's an error in the analysis, which of course needs to be corrected!
- For the follow-on week (last week of classes), I'd like you to devise a way of attacking the question of whether you really can distinguish between H and D. Think of multiple ways of asking and answering the question. I'd also like better calibration. And any other ideas for getting better or complementary data. Following this, then you'll have to make the decision of whether to replace or add to these data you have already.