Uploads by Nimisha J. Tanna
From OpenWetWare
Jump to navigationJump to search
This special page shows all uploaded files.
| Date | Name | Thumbnail | Size | Description |
|---|---|---|---|---|
| 23:35, 3 November 2015 | Dotplot2.PNG (file) |  |
13 KB | |
| 23:34, 3 November 2015 | Dotplot1-2.PNG (file) |  |
14 KB | |
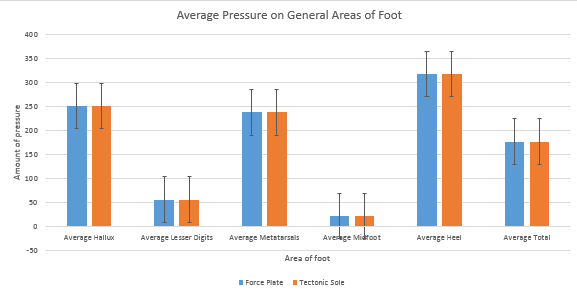
| 20:53, 6 October 2015 | BarGraphAvg.PNG (file) |  |
11 KB | Graph 2. This graph compares the force plate and the Tectonic Sole's measurements of the points that have the most pressure applied on the foot. |
| 20:47, 6 October 2015 | Pressurefoot.PNG (file) |  |
34 KB | This picture shows the main points that typically have the most pressure applied on humans. |
| 20:35, 6 October 2015 | Pointsonfoot.PNG (file) |  |
49 KB | Image 1. This image shows the areas used to determine the figures in Table 2. |
| 20:32, 6 October 2015 | Avgpressurepoints.PNG (file) |  |
8 KB | Table 2. This table shows the comparison of the Tectonic Sole and the force plate for showing the main points with the most pressure on them. |
| 20:17, 6 October 2015 | DSforsteps.PNG (file) |  |
4 KB | Table 1. Differential Statistics showing the average, standard deviation, and the correlation coefficient of the Tectonic Sole and Omron HJ-321 Tri-Axis Pedometer. |
| 20:03, 6 October 2015 | Scatterplotts.PNG (file) |  |
20 KB | This figure shows the comparison of the Omron HJ-321 Tri-Axis Pedometer and the Tectonic Sole in measuring the number of steps taken over a period of time. As shown, the correlation is quite close. The correlation coefficient is .910, which is strong. |
| 12:05, 23 September 2015 | TempDescriptiveStats.png (file) |  |
3 KB | Descriptive Statistics include average, standard deviation, standard error, and p value in degrees Fahrenheit for the temperatures recorded using the Gold Standard meter and the Spree device. |
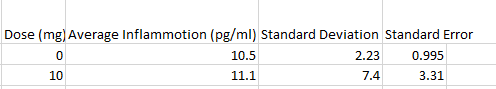
| 10:14, 13 September 2015 | RatStudyDS.PNG (file) | 4 KB | ||
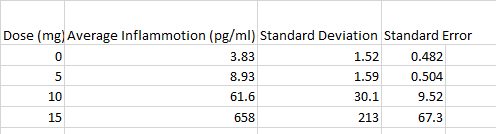
| 09:26, 13 September 2015 | Human StudyDS.PNG (file) | 5 KB |