Shlo/notebook/0704fluorescence
Notes
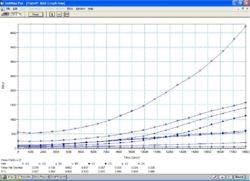
The most important graphs are the ones that compile all the information from the different samples. Relative to each other, the lines are in the right order, though I feel that the distinction and difference between the constitutive, induced, and negative samples is very small - not sure how detectable this is on the FACS. Also, the difference between the 100nM and 10 nM samples is pretty negligible until over 3 hours. At least the results, in a relative way, are as expected. Not sure how to improve these results thought ...?
The top line is the constitutive GFP, and the second highest is the constitutive YFP.
The bottom two lines are the negative controls, where the lower one is the one without any lux construct, and the other is the non-induced.
The pair of lines that is growing linearly (and ends up being the bottom pair at the end) is the one induced with the 10nM, and the higher ones have been induced with 100nM. It's interesting, and perhaps concerning, that the 10nM have fluorescence that grows linearly, and the 100nM fluorescence grows exponentially ... also, the 10nM actually has fluorescence that is higher than the 100nM samples at first. Puzzling.
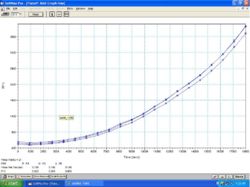
A1to3

A4to6

B1to3

B4to6

C1to3

C4to6

br>
D1to3

D4to6

alldata1

1
alldata2

alldata3
