BME100 f2016:Group6 W8AM L3
| Home People Lab Write-Up 1 | Lab Write-Up 2 | Lab Write-Up 3 Lab Write-Up 4 | Lab Write-Up 5 | Lab Write-Up 6 Course Logistics For Instructors Photos Wiki Editing Help | ||||||||||||||||||||||||
|
OUR TEAM
LAB 3 WRITE-UPDescriptive Stats and GraphHeart Rate Statistics
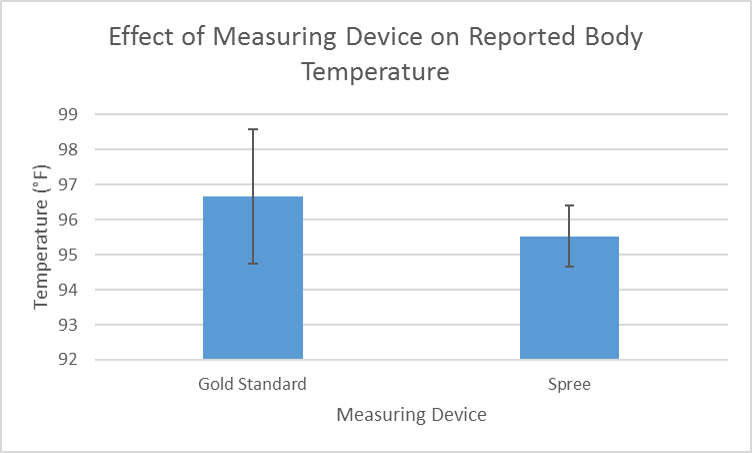
Body Temperature Statistics
Inferential StatsHeart Rate Statistics p-value (paired): 0.4271162 Pearson's r: 0.6908065 The p-value of 0.4271162 is greater than 0.05, indicating that there is no significant difference between the Golden Standard readings and the Spree Band readings for heart rate. Additionally, Pearson's r is close to 1, indicating there is a correlation between the Golden Standard and the Spree Band readings. Body Temperature Statistics p-value (paired): 1.09676E-21 Pearson's r: 0.1927981 The p-value of 1.09676E-21 is much less than 0.05, indicating that there is a significant difference between the Golden Standard and the Spree Band readings for body temperature. Furthermore, Pearson's, 0.1927981, is close to 0, indicating no correlation between the Goldne Standard and Spree Band readings. Design Flaws and RecommendationsAs indicated by the p-values, the Spree band offers accurate heart rate readings but still needs improvements to provide accurate body temperature readings.
Experimental Design of Own DeviceIn order to determine how well our device measures blood oxygen levels its readings will be compared to that of an oximeter. The experimental group will have their blood oxygen levels measured by both our device as well as an oximeter before beginning exercise, every minute during exercise, for four minutes, and immediately after exercise, after four minutes. Exercising is known to increase blood oxygen levels, so by having our test subjects exercise we expect higher blood oxygen level readings post-exercise as opposed to pre-exercise. By measuring and monitoring blood oxygen levels during exercise we expect to see a general increasing trend of oxygen levels. In order to eliminate variability we will test as many test subjects as possible, a sample size of 100 people, 50 asthma patients and 50 people without asthma.
| ||||||||||||||||||||||||


