BME100 f2013:W900 Group4 L2

From OpenWetWare
Jump to navigationJump to search
BME 100 Fall 2013 Home
People
Lab Write-Up 1 | Lab Write-Up 2 | Lab Write-Up 3
Lab Write-Up 4 | Lab Write-Up 5 | Lab Write-Up 6
Course Logistics For Instructors
Photos
Wiki Editing Help


TEAM PHILIP, with Elliott, Sierra, and Aaron

Name: Sierra Headrick
Role(s)
Name: Elliott Tejada
Role(s)
Name: Aaron Blank
Role(s)
Name: Philip Terzic
Role(s)
Name: student
Role(s)
Name: student
Role(s)

LAB 2 WRITE-UP

Descriptive Statistics

Experiment 1--Rat Study
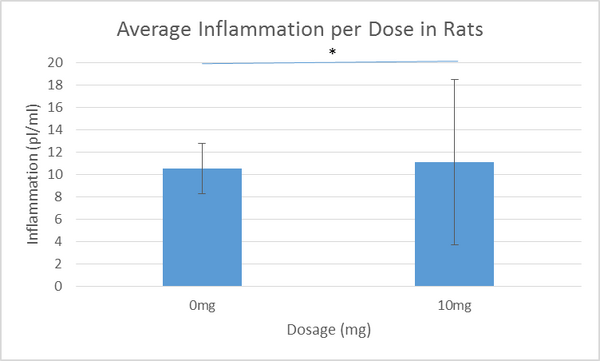
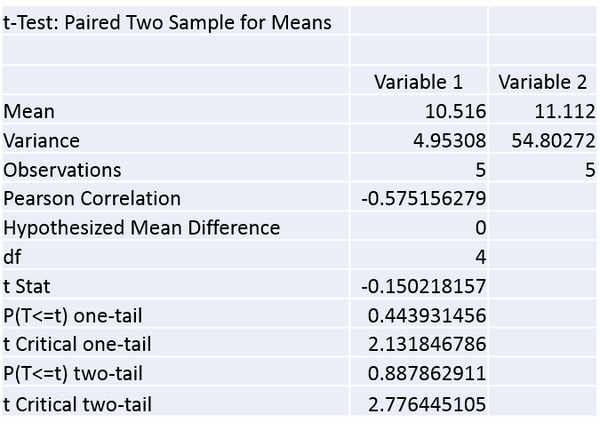
In order to study the effects of inflammation in various dosages of LPS, a dosage of 0mg and a dosage of 10mg were given to 5 rats each. The average resulting inflammation for the 0mg dosage was 10.5 pg/ml with a standard deviation of 2.23 pg/ml and a standard error of 0.995 pg/ml. The average inflammation for the 10mg dosage was found to be 11.1 pg/ml with a standard deviation of 7.40 pg/ml and a standard error of 3.31 pg/ml.

Experiment 2--Human Study
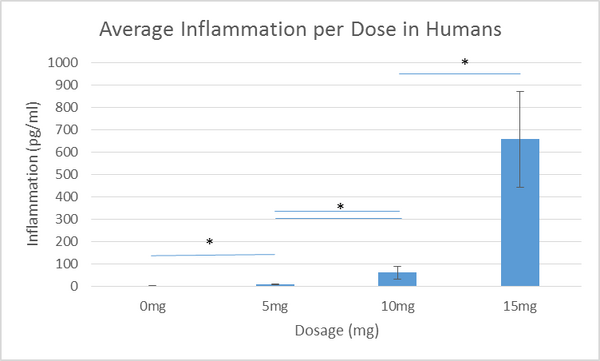
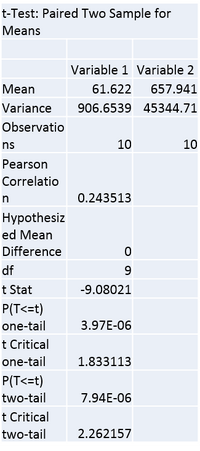
A similar study was performed using humans with an average age of 67.7 years with a range between 60 and 82 years of age. The range between dosages was reduced in order to have more precise information. The dosages tested were 0mg, 5mg, 10mg and 15mg. For the 0mg dosage, the average inflammation was 3.83 pg/ml with a standard deviation of 1.52 pg/ml and a standard error of 0.482 pg/ml. The average inflammation for the 5mg dosage was shown to be 8.93 pg/ml with a standard deviation of 1.59 pg/ml and a standard error of 0.504 pg/ml. The average for the 10mg dosage was calculated to be 61.6 pg/ml with a standard deviation of 30.1 pg/ml and a standard error of 9.52 pg/ml. The 15mg average inflammation was found to be 658 pg/ml with a standard deviation of 213 pg/ml and a standard error of 67.3 pg/ml.


Results

Experiment 1 - Rat Study
Inflammation in Rat subjects due to LPS

Experiment 2 - Human Study

Inflammation in Human subjects due to LPS


Analysis

Experiment 1 -- Human Data
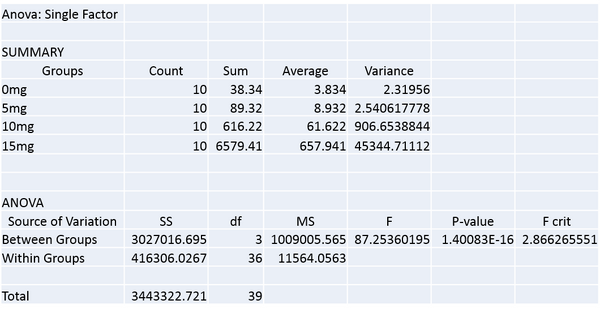
ANOVA Test for Human Data:
Description of image
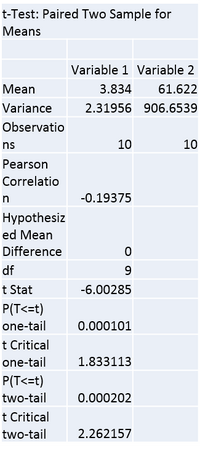
Bonferroni Correction (0mg vs 5mg):
Description of image
Bonferroni Correction (0mg vs 10mg):
Description of image
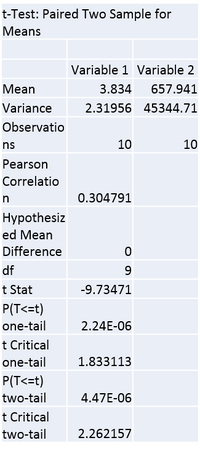
Bonferroni Correction (0mg vs 15mg):
Description of image
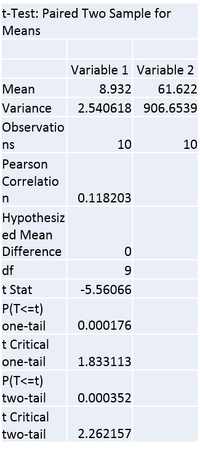
Bonferroni Correction (5mg vs 10mg):
Description of image
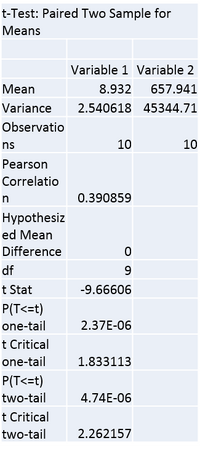
Bonferroni Correction (5mg vs 15mg):
Description of image
Bonferroni Correction (10mg vs 15mg):
Description of image

Experiment 2 -- Rat Data
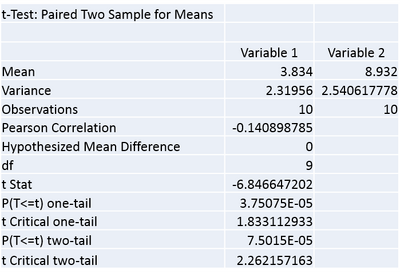
T-Test for Rat Data:
Description of image


Summary/Discussion

In the human experiment, an ANOVA test was used and it was found that the p-value (1.4e^-16) was less than the alpha (.05). A Bonferroni Correction was also used and all of the p-values resulting from this test were less than the alpha (0.0167). With this in mind, it can be said that the results of the human test are statistically significant. As the dosage of LPS increased the amount of inflammation appeared to increase in human subjects. The results in this experiment may not represent the true results of the population because all the subjects are from one retirement home and these subjects may not represent the diversity of the entire population due to a convenience bias. In the rat experiment a t-test was used and it was found that the p-value (.888) was greater than the alpha (.05). Since the p-value is greater than the alpha, the data is not statistically significant and the inflammation in rats does not necessarily increase as the dose of LPS increases. These results likely do not represent the results of the population of rats because the sample size of rats (5 rats per group) is very small and the number of treatment groups (two) was also small.