BME100 f2013:W1200 Group10 L3
| Home People Lab Write-Up 1 | Lab Write-Up 2 | Lab Write-Up 3 Lab Write-Up 4 | Lab Write-Up 5 | Lab Write-Up 6 Course Logistics For Instructors Photos Wiki Editing Help | |||||||
|
OUR TEAM
LAB 3A WRITE-UPDescriptive StatisticsThe Descrptive Statistics for the data set include two separate groups: the oral thermometer and the sensor groups. When looking at the sensor group,the average was 96.14 degrees Fahrenheit, which had a standard deviation of 1.64. Also, the standard error was 0.132 and the median of the data set was 96.3 degrees Fahrenheit. Now with the oral thermometer readings, the average was 97.57 degrees Fahrenheit, which had a standard deviation of 1.03. In addition, the standard error was 0.0830 and the median of the recordings is 97.6 degrees Fahrenheit.
Results3a results: AnalysisBased on the data, the t-test indicates that the sensor failed to create temperature readings similar to the oral thermometer. A p-value of 1.919E-16, which is well below .05, indicates that with 95 percent confidence, researchers can claim that a difference exists between the sensor and oral thermometer. A successful sensor thermometer would register similar if not the same temperatures as the oral thermometer. However, the t-test indicates that the sensor device is inaccurate in comparison to the oral thermometer. The regression analysis graph produced a value of .005, indicating that there is little correlation between the oral and sensor temperatures.
Summary/Discussion
LAB 3B WRITE-UPTarget Population and NeedThis product is targeted toward parents of sick children. Parents require an efficient temperature reading device that provides precise and accurate results. Young children are the most susceptible to contracting contagious illnesses. Therefore in times of sickness, parents are able to monitor their children's conditions regularly and provide care accordingly.
Device DesignIn the picture of the device, there are only a few main components that make up the headband thermometer. The device is suppose to go around your head and the sensor will be placed over the temporal artery to directly measure the person's body temperature. The temporal artery is known to be a reliable source of internal body temperature due to its connection as a main artery to the heart, and thus was chosen for accuracy and convenience of location. Then the wire is connected to a battery pack to power the bluetooth and send data to a cellular device capable of bluetooth communication, and then sent to an online data base so parents can keep track of the temperature being monitored from anywhere. This device was designed to potentially be built into a hat for concealment, sewn into the hat's band.
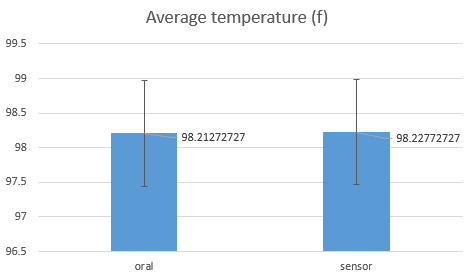
Inferential StatisticsThe data for the product that we designed is as follows: The t test for this data gave us a value of .259 and the regression analysis gave us an r value of .9937
Graph3b results:
| |||||||


