BCH4160/2011:Notebook/Amanda Tindall
Project Description/Abstract
- This notebook details the laboratory experiments completed during the fall 2011 semester.
November 8th, 2011
With User:Andrew Varipapa
Goals Prepare reagents for fluorescence measurements on November 15th.
1. Measure the pH of 1M phosphate buffer from August 30th. Confirm the pH of 7.07.
2. Add 0.0009g of peptide solution (MW 642.79 g/mol) to 1mL of phosphate buffer.
3. Measure the absorbance of the solution at 280nm.
4. Calculate the concentration of the solution with Beer's Law A=εbc, where ε=5579M-1cm-1, b=1cm.
5. Prepare 3 dilute 1mL solutions in phosphate buffer for analysis with concentrations of , , and.
6. Store solutions at 4°C for 1 week.
November 1st, 2011
With User:Andrew Varipapa
Goals Visualize PCR products; determine the identity of the Crime Scene DNA
1. Make agarose gel: Add 1.35g agarose to 45mL 1X TAE buffer (BioRad). Bring solution almost to boiling to dissolve agarose.
2. Pour gel into gel box and allow gel to solidify.
3. Add 10μL of orange loading buffer to PCR samples from Oct. 25th.
4. Add 20μL of sample to each lane:
    1. Ladder
    2. Crime Scene DNA
    3. Suspect A
    4. Suspect B
    5. Suspect C
    6. Suspect D
5. Run gel at 100V for 30 minutes.
6. Add undiluted stain to gel for 5 minutes.
7. Rinse with warm water for 1 minute intervals 10 times.
8. Leave overnight, change water, leave for another day, photograph.
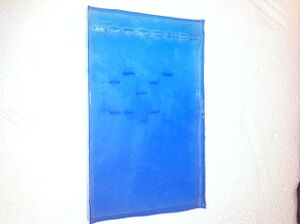
According to the image, the crime scene DNA (lane 2) most closely resembles suspect C (lane 5).
October 25th, 2011
With User:Andrew Varipapa
Goals Set up PCR reactions to amplify DNA samples.
Procedure 1. Obtain materials on ice: Master Mix, Primers, Crime Scene DNA, Suspects A, B, C, and D.
2. Add 6μL primers to 300μL master mix. Mix well and store on ice.
3. Add the following reactants to the PCR tubes:
| Sample | DNA Template (μL) | Master Mix/Primer Solution (μL) |
|---|---|---|
| Crime Scene DNA | 20 | 20 |
| Suspect A | 20 | 20 |
| Suspect B | 20 | 20 |
| Suspect C | 20 | 20 |
| Suspect D | 20 | 20 |
Place PCR tubes in the thermocycler with the following protocol:
    1. 94°C for 120s
    2. 94°C for 30s
       52°C for 30s
       72°C for 60s
       X35
    3. 72°C for 10 min
    4. 4°C for ∞
October 4th, 2011
With User:Andrew Varipapa
Goals: Test and calculate rate p-nitrophenyl glucopyranoside is converted to p-nitrophenol and glucose by cellobiase with and without urea in solution.
Solution Preparation:
1. Prepare 1X resuspension buffer (RB) from 10X solution. (16.7:150)
2. Prepare high concentration enzyme (0.01:1): 200μL 1X RB to 133μL enzyme. Add 1mL dilute enzyme to 63mL 1X RB.
3. Prepare low concentration enzyme (2.5e-3:1): 6.67ml high concentration enzyme to 60 mL 1X RB
4. Prepare 3mM substrate: Add 0.33mL 1X RB to vial, mix, add to 32.7mL 1X RB. Add another 0.33mL 1X RB to vial, mix, add to 33mL solution, mix.
5. Prepare 1.5mM substrate: Add 25mL 3mM substrate to 25mL 1X RB.
6. Prepare 1X Stop solution: Add 100mL 2X stop solution to 100mL dH2O
7. Prepare standard solutions:
-Label 5 50mL tubes S1-S5
-Add 6.7mL dH2O to each tube
-Add 1.3mL standard and 2mL dH2O to S5
-Transfer 6.7mL standard from S5 to S4, mix
-Transfer 6.7mL from S4 to S3, mix
-Transfer 6.7mL from S3 to S2, mix
-Transfer 6.7mL from S2 to S1, mix
-Add 10mL 1X stop solution to all tubes, mix.
8. Urea Solution Preparation
-For 8m solution, add 4.8048g Urea to 10mL RB
-Dilute 8m solution to 2m and 4m in cuvettes by adding
Rate of Reaction Determination
1. Add RB, Urea, and substrate to cuvette. Place in spectrometer. Add enzyme to reaction and monitor p-nitrohenol absorbance at 410nm over ___ minutes.
2. Record reaction rate in triplicate for each urea concentration
| Urea Stock (μL) | Substrate (μL) | Enzyme (μL) | Resuspension Buffer (μL) |
|---|---|---|---|
| 0 | 100 | 50 | 450 |
| 179 | 100 | 50 | 271 |
| 358 | 100 | 50 | 92 |
September 27th, 2011
Protocol:
1. Investigate the program QtiPlot
2. Construct a graph with an arbitrary data set.
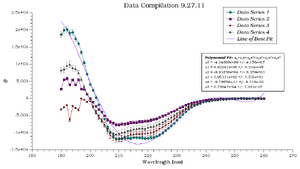
3. Add error bars of 4% to Data Series 1, 6% to Data Series 2, 8% to Data Series 3, and 10% to Data Series 4.
4. Calculate a polynomial fit with five terms: a0+a1x+a2x2+a3x3+a4x4+a5x5 where a0=-4.34689e+08 +/- 4.158e+07, a1=9.82291e+06 +/- 9.334e+05, a2=-8.83258e+04 +/- 8.359e+03, a3=3.95131e+02 +/- 3.733e+01, a4=-8.79658e-01 +/- 8.316e-02, a5=7.79847e-04 +/- 7.391e-05.
September 6th, 2011
Protocol:
1. Determine the optimal volume of methyl red to add to the sample. Cuvette volume will be equal to 600μL.
2. Add determined volume of methyl red to 2M hydrochloric acid and 2M sodium hydroxide. Read the spectrum and determine the wavelength which depends on methyl red concentration.
3. For each buffer solution, read the pH and measure the absorbance at both wavelengths determined in step 2.
For additional information: BCH4160/2011:Notebook/Dr Cannon Samples/Protocol MethylRedAbs
Results:
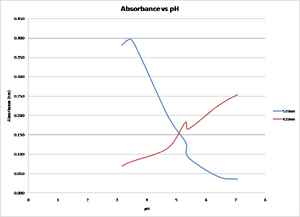
Ratio of methyl red to sample: 50:550μL
Methyl Red absorbance in acid: 520nm
Methyl Red absorbance in base: 420nm

|
 |
 |
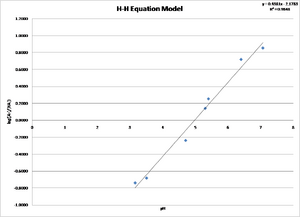 |
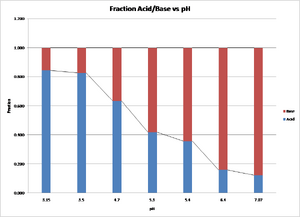
The value of log [A-]/[HA] for methyl red can be determined from the equation y=0.4381x-2.1783 where x is the pH. The value of the x intercept is calculated to be 4.972. The value of the x intercept is the pKa for methyl red. The accepted value is 5.1, which represents a 2.5% variation.
August 30th, 2011
Buffers:
| pH | 1M Acetic Acid (mL) | 1M Sodium Acetate (mL) |
|---|---|---|
| 3.75 | 44.15 | 5.51 |
| 4.0 | 40.35 | 9.65 |
| 5.0 | 14.15 | 35.79 |
| 5.5 | 5.64 | 44.36 |
| pH | 1M Acetic Acid (mL) | 1M Sodium Acetate (mL) |
|---|---|---|
| 6.2 | 39.74 | 10.22 |
| 7.0 | 22.69 | 27.26 |
| 7.5 | 12.26 | 37.64 |
Notes
- This is a new project
- 2017-09-27 03:48:37 BCH4160/2011:Notebook/Amanda Tindall/Entry Base
