User:Mary Mendoza/Notebook/CHEM 581: Experimental Chemistry I/2014/09/05: Difference between revisions
From OpenWetWare
Mary Mendoza (talk | contribs) |
Mary Mendoza (talk | contribs) |
||
| Line 7: | Line 7: | ||
<!-- ##### DO NOT edit above this line unless you know what you are doing. ##### --> | <!-- ##### DO NOT edit above this line unless you know what you are doing. ##### --> | ||
==Calibration Curves for Malachite Green== | ==Calibration Curves for Malachite Green== | ||
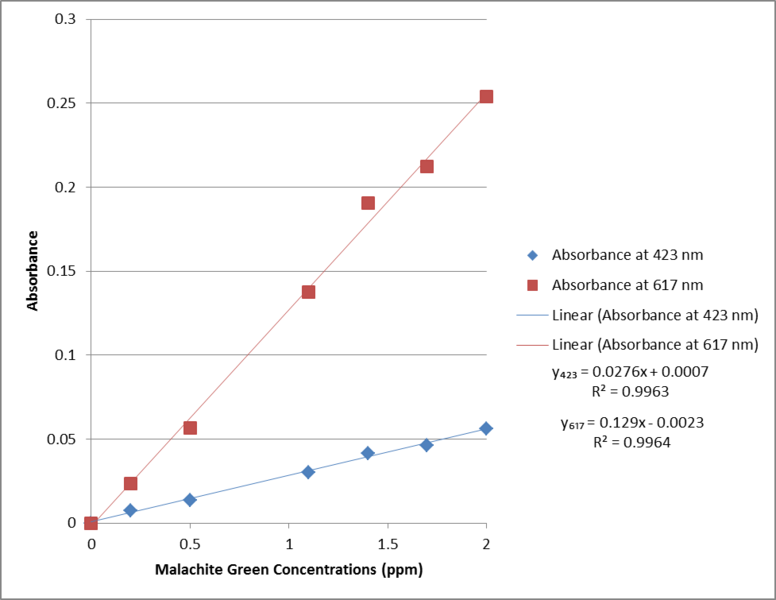
* After saving the data from the data print table with the correct wavelength range (200-800nm), the absorbance at 423 and 617 nm of malachite green were plotted against the concentrations 0.2, 0.5, 1.1, 1.4, 1.7, and 2.0 ppm. | * After saving the data from the data print table with the correct wavelength range (200-800nm), the absorbance at 423 and 617 nm of malachite green were plotted against the concentrations 0.2, 0.5, 1.1, 1.4, 1.7, and 2.0 ppm using MS Excel. | ||
[[Image:MG calibration curve MJJ.png|center|776x600px|thumb|Calibration Curves of Malachite Green concentrations; 0.2, 0.5, 1.1, 1.4, 1.7, and 2.0 ppm, at 423 and 617 nm]] | |||
Revision as of 22:09, 9 September 2014
| <html><img src="/images/9/94/Report.png" border="0" /></html> Main project page <html><img src="/images/c/c3/Resultset_previous.png" border="0" /></html>Previous entry<html> </html>Next entry<html><img src="/images/5/5c/Resultset_next.png" border="0" /></html> | |
Calibration Curves for Malachite Green

| |