DataONE:Notebook/ArticleCitationPractices:Analysis
From OpenWetWare
Jump to navigationJump to search
Analysis in Progress
- I appreciate any and all suggestions on my analysis steps and codes. I would also like input on possible visualizations.
- Code (zip): Media:AnalysisArticleCitationPractices.zip
- Code (open source): on github SOON!
- My apologies again for not getting the code up sooner. I'm in the midst of transferring the code from a sloppy layout that I wouldn't wish upon anyone else to have to navigate.
Univariate Results
- I appreciate advice on where to go from here and critiques on my "interpretation".
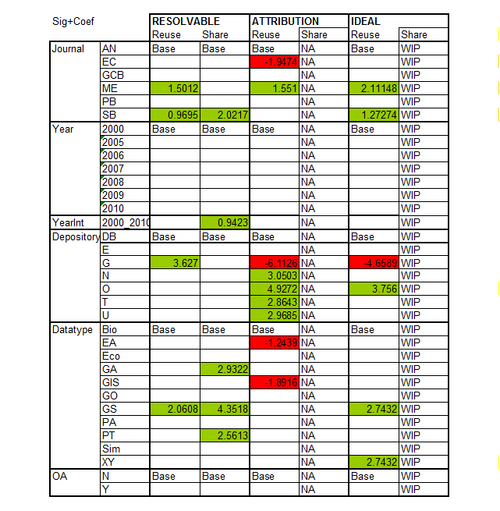
- From this, I think the main interaction I will be looking at in the multivariate analysis is Journal vs. Datatype vs. Depository...these factors are potentially correlated and can hopefully be parsed out a bit better with multivariate. I plan to look at this with both my specific and broad factor classifications.
- Sarah Judson 19:30, 2 August 2010 (EDT):I realized I forgot to explain this table. It shows the regression coefficients only for the significant factor states. Generally (depending on the reference factor state), red (negative) indicates "poor" citation quality and green (positive) indicates "good" citation quality.
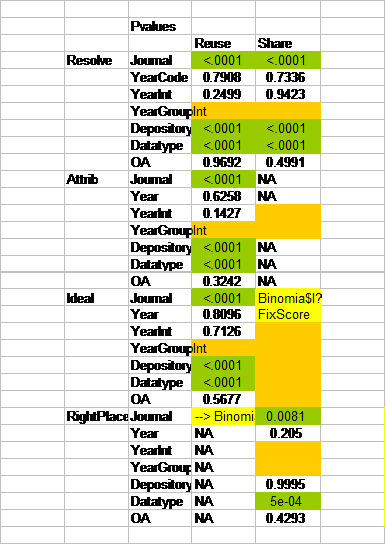
- See Statistics Summary (Excel)-->Sheet:Univariate-->Column:AH Row:81 for my preliminary interpretation of the results and my resulting analysis plans.
- Most metrics in both sharing and reuse indicate significant trends in Journal, Depository, and Datatype
- My apologies for the blurry pictures....original tables can be viewed by downloading Statistics Summary (Excel).
Multivariate Results
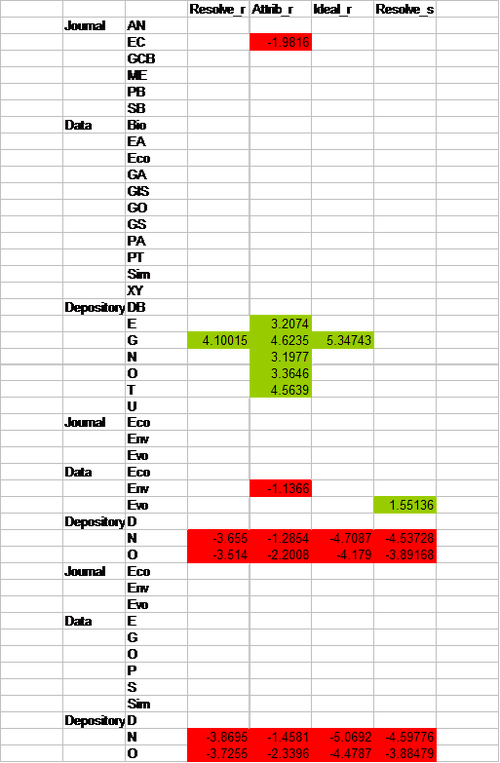
- Investigation of the interaction between journal, data type, and depository.
- Like the table in univariate results, this table shows the regression coefficients only for the significant factor states.
- I investigated both specific and broad factor classifications. I plan to rely mostly on the specific factor classifications.
- Depository is the only significant factor across all categories.
Preliminary Analysis
- See Final Spreadsheet with Coding/Scoring in Progress:Media:WorkingSpreadsheet_21July2010_DataCollectionComplete.xls
- Preliminary R file Media:TinnRPrelimAnalysis.txt, Media:TinnRPrelimAnalysis.zip
Outlined plan
- emphasis on: is quality data reuse/sharing happening + HOW is data reuse/sharing happening
- Criteria (reuse)
- attribution
- x percent cited original data authors in the biblio (attribution)
- x percent of above were reuses of personal data (figure out a way to discern without credit to original authors (previous review) vs. previous study)
- self reuses typically indicated in "Aquired" column, but should also be a combo of "How cited" = au and "Biblio" = 0
- acquirement/resolvability
- x percent mentioned the depository (acquirement)
- x percent give accession (acquirement)
- x percent only depository, x percent only accession
- x percent both
- if these correlate to journal or datatype (and maybe open access)
- stats = Anova: of percent (total?) YN vs. journal/datatype
- how this has changed/improved by journal from 2000 to 2010 (and in more detail from 2005-2010 in amnat/sysbio)
- attribution
- Scoring (reuse)
- resolvable (depository + accession)
- attribution (author year + accession + biblio, not self) - i.e. gives credit to the author and the data
- ideal = resolvable + attribution
- meets journal/depository recommendations
- stats = ordinal regression/loglinear model (score vs. journal/datatype)
- Criteria (sharing)
- x percent mention depository
- x percent give accession
- x percent do both
- x percent share all data
- if these correlate to journal or datatype (and maybe open access)
- stats = Anova: of percent (total?) YN vs. journal/datatype
- Scoring (sharing)
- percent shared vs. produced
- stats = anova - above metric is continuous, journal/datatype is categorical
- resolvable (depository + accession)
- percent shared vs. produced
- discussion
- what aspects of a citation (reuse or sharing) are most commonly missing? (pre-analysis, I would say accession, and especially author+accession....many
either/or)
- from observing current practices, we recommend a, b, and c" for policies and authors
- see Knoxville ppt (i.e. methods section, most do so advise that all do = easier for copyeditors, authors, and reusers; preference for accession tables
- from observing current practices, we recommend a, b, and c" for policies and authors
with author reference...give example)
- report that no biblio citations had hdl/doi/accession of data --> suggest data citation biblio format
- report attribution and resolvability problems
- appendix tables with citations = not linked to ISI, etc for tracking
- dead urls (or difficult to navigate)
- Migrated datasets (treebase and sysbio problems in particular)
For Knoxville
- Snapshot and Time series of SysBio and AmNat
- graphs/tables
- side by side comparisons of sysbio and amnat
- % reuse per year (per issue for snapshot)
- which depositories used (and frequency)
- % "proper" citation
- type of data correlated with reuse
- graphs/tables
- comments on Molecular Eco and Ecology snapshots
- Anecdotal stuff
Final Analysis Ideas
- supplementary data vs. externally vs. deposited vs. produced (ratios of YN for paperdatasetcited, supplementary data, and data produced
- get opinions: maybe calculate a score of how well a dataset was cited (minus poinrs for unspecified, plus double points for accession)
- data produced vs. data shared/reuse may be a more fair metric than just reuse/share y/n
- possibilities:
- Percentages
- % extinct urls from personal/other share list (illustrates one reason depositories should be employed)
- % reuse per journal per year (or per discipline, funder, etc)
- % sharing per journal per year
- % sharing vs. % produced
- % that could have been put in relevant depository but weren't (especially treebase)
- Scoring
- "quality" reuse citation (journal/repository specific?)
- % sharing vs. % produced
- Correlations
- dataset type (or journal, discipline, nationality, funding type) to YN/quality reused/shared
- open access to data reuse/sharing
- something with multiple datasets
- statistics: ordinal regression, anova, clustering, correlation
- additional statistics to do: percent improvement from 2000 to 2010 (would be a better measure for journals like ecology which have few reuses); could do this
- Percentages
- for citation quality, incidences of reuse, and incidences of sharing/or sharing/production %
- also (similar) % increase in utilization of depositories (esp. treebase)-->but then in discussion, state that treebase still under utilized judging by amount of pt and ga prodcuced that aren't posted. (? could depositories be more active and contact authors to deposit in them after they see a paper published? or accepted....this could capitalize on relationships with editoral boards of journals)


