User:Omar Choudary/Notebook/Omar Choudary CHEM-571 AU-2011/2012/2012/02/21

From OpenWetWare
Jump to navigationJump to search
Chem-571 Main project page
Previous entry      Next entry


Objective

  • Perform UV-Vis and Flurosescence Spectroscopy of the three dye solutions from the previous experiment.

Description

  • Prepared a BSA control solution:

1. 8 mL water + 1 mL HCl (2.84 mM) + 1 mL BSA (17.7 μM)

2. 2 hours in the oven (80°C)

  • Finish Dialysis:

1. Centrifuge the 70 and 166 Au/BSA ratio solutions (5 minutes at 13200 rpm)

  • UV-Vis : Use Shimadzu 2550 spectrophotometer, with wavelength range from 200 - 800 nm to measure absorbance of the following samples:

1. BSA control with dye

2. 70 ratio with dye (partially full cuvette)

3. 166 ratio with dye (partially full cuvette)

4. 70 ratio with dye (higher volume in cuvette)

5. 70 ratio without dye (control)

6. 166 ratio without dye (control)

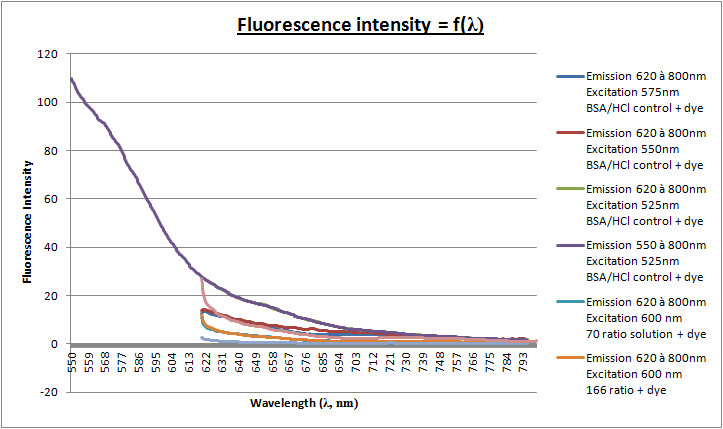
  • Fluorescence spectroscopy: Use LS55 PerkinElmer fluorescence spectrometer, with emission range from 620 to 800nm and excitation at 600nm.

1. BSA control with dye (NADH70)

2. BSA control with dye (excitation at 575nm)

3. BSA control with dye (excitation at 550nm)

4. BSA control with dye (excitation at 525nm)

5. 70 ratio with dye

6. 166 ratio with dye

  • Prepared control solution with only dye

1. 80 μL DMSO

2. 1 mg Dye

3. 5 mL H2O

  • Centrifugation

1. 70 ratio solution with dye

2. Dye control solution

Data

  • UV-Vis Data

  • Fluorescence Data

Notes

  • UV-Vis Spectroscopy data can be used to calculate the concentration of gold nano particles in solutions because gold absorbs at 550 nm. The range used was 200 - 800 nm. Fluorescence spectroscopy can be used to calculate the amount of dye tagging lysine residues in BSA. The dye absorbs at 602 nm and emits at 672 nm. There were no peaks observed in the emission spectra for any of the solutions.