BISC110: Series 3 Experiment 9 Hill Reaction: Difference between revisions
Tucker Crum (talk | contribs) |
Tucker Crum (talk | contribs) |
||
| Line 118: | Line 118: | ||
'''B. Running the Hill reaction''' (work in pairs) | '''B. Running the Hill reaction''' (work in pairs) | ||
<br><br> | <br><br> | ||
1. Materials: Each pair will have a ring stand with a test tube holder, and a fiber-optic illuminator with a 150W quartz-halogen projection lamp. You will have to find the best arrangement to measure the reduction of DCPIP accurately and reproducibly. A handheld light meter and timer will be provided. Set up 5 ‘reaction tubes’ to begin with, adding 5mL of reaction mixture, but do not add the thylakoid membranes, which must be kept on ice. Add these thylakoid membranes just before each reaction mixture is tested. [Reaction mix: 50mM sodium phosphate, pH 6.8 buffer, 100mM sorbitol, 5mM MgCl2, 0.05mM DCPIP] | 1. Materials: Each pair will have a ring stand with a test tube holder, and a fiber-optic illuminator with a 150W quartz-halogen projection lamp. You will have to find the best arrangement to measure the reduction of DCPIP accurately and reproducibly. A handheld light meter and timer will be provided. Set up 5 ‘reaction tubes’ to begin with, adding 5mL of '''reaction mixture''', but do not add the thylakoid membranes, which must be kept on ice. Add these thylakoid membranes just before each reaction mixture is tested. [Reaction mix: 50mM sodium phosphate, pH 6.8 buffer, 100mM sorbitol, 5mM MgCl2, 0.05mM DCPIP] | ||
<br><br> | <br><br> | ||
2. Blanking the Spectrophotometer ([[Appendix B]]): Use a tube containing 5mL of resuspension solution and 50µL of your thylakoid suspension to blank the Spec20 at 580nm (filter level to the left). With Parafilm® over the top of the tube, invert once to mix, then wipe the tube with a Kimwipe® before blanking the instrument. Do not vortex. You may need to prepare a fresh blank periodically. | 2. Blanking the Spectrophotometer ([[Appendix B]]): Use a tube containing 5mL of '''resuspension solution''' and 50µL of your '''thylakoid suspension''' to blank the Spec20 at 580nm (filter level to the left). With Parafilm® over the top of the tube, invert once to mix, then wipe the tube with a Kimwipe® before blanking the instrument. Do not vortex. You may need to prepare a fresh blank periodically. | ||
<br><br> | <br><br> | ||
3. Varying the Reaction Rate: The Hill reaction occurs at different rates depending on the amount of light supplied to the thylakoids. You will measure the reaction rate by taking absorbance readings over a 90s period in 15s intervals. We will use the drop in absorbance over time as a measure of the rate of the Hill reaction. | 3. Varying the Reaction Rate: The Hill reaction occurs at different rates depending on the amount of light supplied to the thylakoids. You will measure the reaction rate by taking absorbance readings over a 90s period in 15s intervals. We will use the drop in absorbance over time as a measure of the rate of the Hill reaction. | ||
| Line 130: | Line 130: | ||
You can vary the illuminance of the sample by varying the setting of the intensity knob on the fiber-optic illuminator. Your instructor will demonstrate how to measure the illuminance in units of lux. You will begin by running an experiment at 1,000 lux, taking readings every 15s for 90s. If the drop in A580 per 15s interval is <0.05, repeat the experiment, increasing the illuminance in steps of 1,000 lux, until you have obtained a reaction rate in the 0.05–0.07 A580–drop–per–15s range. | You can vary the illuminance of the sample by varying the setting of the intensity knob on the fiber-optic illuminator. Your instructor will demonstrate how to measure the illuminance in units of lux. You will begin by running an experiment at 1,000 lux, taking readings every 15s for 90s. If the drop in A580 per 15s interval is <0.05, repeat the experiment, increasing the illuminance in steps of 1,000 lux, until you have obtained a reaction rate in the 0.05–0.07 A580–drop–per–15s range. | ||
<br><br> | <br><br> | ||
4. Measurement of Hill Reaction Rates: For each reaction tube, do the following in turn and work as rapidly as possible and in dim light. Mix thylakoid suspension gently by flicking bottom of tube. Immediately remove 50µL of thylakoid suspension and add to a reaction tube, mix gently by inverting once and place tube in the Spec20 to obtain a "dark reading" with the spectrophotometer set at 580nm. This is the time = zero seconds absorbance reading. Take care not to shield the tube from the light with your hand. Take absorbance readings every 15s (10s illumination + 5s reading) for 90s (7 readings). Record absorbance readings and times in your lab notebook. Repeat the experiment, i.e., do several 90s runs, until you obtain the desired reference rate of DCPIP reduction. Then repeat the experiment, to see if you can reproduce your data consistently. | 4. Measurement of Hill Reaction Rates: For each reaction tube, do the following in turn and work as rapidly as possible and in dim light. Mix '''thylakoid suspension''' gently by flicking bottom of tube. | ||
5. Immediately remove 50µL of '''thylakoid suspension''' and add to a reaction tube containing 5mL of '''reaction solution''', mix gently by inverting once and place tube in the Spec20 to obtain a "dark reading" with the spectrophotometer set at 580nm. This is the time = zero seconds absorbance reading. Take care not to shield the tube from the light with your hand. | |||
6. Take absorbance readings every 15s (10s illumination + 5s reading) for 90s (7 readings). Record absorbance readings and times in your lab notebook. Repeat the experiment, i.e., do several 90s runs, until you obtain the desired reference rate of DCPIP reduction. Then repeat the experiment, to see if you can reproduce your data consistently. | |||
<br><br> | <br><br> | ||
7. Plotting the Data: The reduction of DCPIP is linear until the curve begins to level off near the end of the reaction. Since you are interested in the rate of DCPIP reduction, you are primarily concerned with the straight-line portion of the curve. To facilitate your comparison of the different rates of reaction, plot your data as a scatter graph, and add a trendline (simple linear regression: [[Appendix E]]). Include in your regression plots only data points that are in the linear portion of the curve. Do not include data points that are clearly in the leveled-off portion of the curve. Regression plots allow us to compare any two 90s experiments in a quantitative manner, using the slopes of the regression lines. | |||
<br><br> | <br><br> | ||
'''Laboratory Cleanup''' | '''Laboratory Cleanup''' | ||
Revision as of 20:24, 9 November 2009
Series 3- Lab 9 Photosynthesis -The Hill Reaction
In this lab you will examine the light reactions of photosynthesis by measuring the so-called Hill reaction in lysed chloroplasts. You will practice these measurements until you get reproducible results. Next week you will investigate the effect of various environmental factors on the light reactions of photosynthesis. The Hill Reaction is named for a British biochemist, Robert Hill. 
Image from www.bio.cam.ac.uk/~howelab/
Introduction
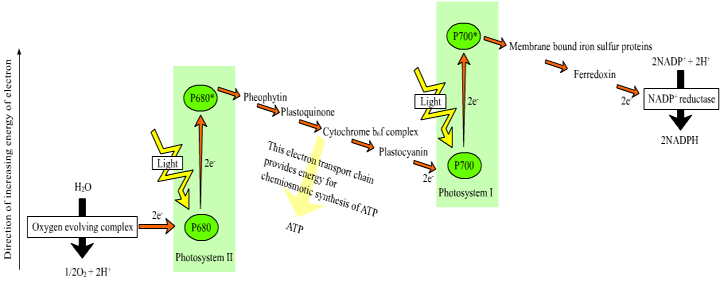
Central to life on Earth is the photochemical process carried out by plants and cyanobacteria, wherein quanta of light are converted into chemical energy. In plants, light is absorbed by chlorophyll and other antenna pigments of the light-harvesting complexes of Photosystems I and II. The energy from these photons is then passed via resonance energy transfer to a special pair of chlorophyll a molecules located in the reaction center, leading to the excitation and loss of electrons from these molecules. In each photosystem the excited electron from one reaction center chlorophyll is passed to the quinone primary electron acceptor thereby reducing it. The primary acceptor immediately donates its electrons to a neighboring molecule and so on through an electron transport chain to ultimately reduce NADP+ to NADPH. The resulting oxidized reaction center of photosystem II is able to split water molecules into protons, electrons and O2. The electrons extracted from water replace the electrons lost by the reaction center II chlorophyll. The reaction center chlorophyll of photosystem I is reduced by electrons coming from photosystem II.

Image from http://commons.wikimedia.org/wiki/File:Z-scheme.png
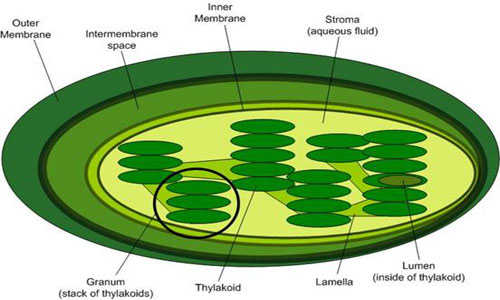
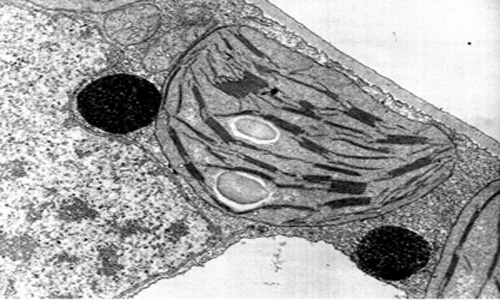
This electron transport is coupled in two steps to the formation of ATP through the mechanism of chemiosmosis. First, during the light reactions, the transport of electrons is coupled to the movement of protons from the stroma to the thylakoid lumen, forming a pH gradient across the thylakoid membrane. The sources of these protons are the splitting of water, which occurs on the lumenal side of the thylakoid membrane, and the transport of protons from the stromal side across the membrane into the lumen by the electron transport chain components plastoquinone and cytochrome b/f complex. In the second step, this gradient of protons is released when the protons diffuse through the membrane-spanning ATP-synthase molecule, which couples proton movement to the synthesis of ATP from ADP and Pi.


Top Image from leavingbio.net/PHOTOSYNTHESIS.htm
Bottom Image from biologyofcells.blogspot.com/
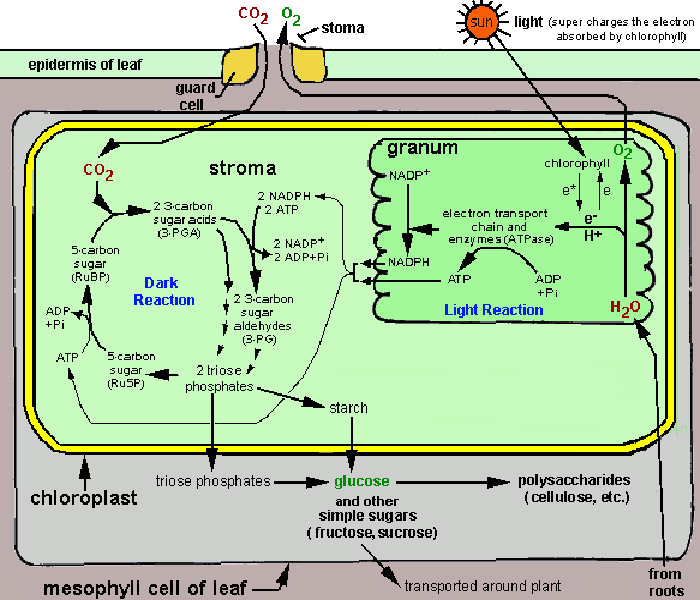
The process resulting in the formation of NADPH and ATP is called non-cyclic photophosphorylation.

Image from hort201.tamu.edu/lectsupl/physiol/physiol.html
In this lab you will be studying the photosynthetic electron transport of thylakoid membranes isolated from spinach chloroplasts. During the isolation procedure, some of the more water-soluble components that function near the terminus of the main electron transport chain are lost. This makes it impossible to follow the production of ATP or the reduction of NADP+ in your preparations.
As is routine in studies using mitochondria and chloroplasts, we will supply an artificial electron acceptor to monitor "partial reactions" of the electron transport. These are chemicals that accept electrons at positions of the electron transport chain where exogenous compounds normally do not act in vivo. Frequently these electron acceptors are dyes specifically selected so their reduction can be monitored by spectrophotometry.
The dye reagent we are using in this experiment is 2,6-dichlorophenol indophenol (DCPIP). It is blue when oxidized and colorless when reduced. DCPIP accepts electrons between the electron chain components plastoquinone and cytochrome. The electrons are ultimately derived from water.

DCPIP reduction

Animation from smabiology.blogspot.com/2008_12_01_archive.html
In 1937 Robert Hill showed that this partial reaction of the electron transport chain using DCPIP could be used to investigate the rate of oxygen evolution (from the splitting of water molecules in PSII) and thus the rate of photosynthesis in thylakoids of isolated chloroplasts. The reaction is now known as the Hill reaction and is still used today to determine photosynthetic rates in chloroplast preparations.

In vivo reaction

In vitro reaction
For the isolation of chloroplasts from spinach, a buffer is used since the leaves, when homogenized, can yield a low pH suspension. In the initial isolation step, the sorbitol serves to maintain an osmotic potential similar to that of an intact leaf. The divalent cation Mg2+, known to be important to membrane structure and function, is also included in the medium. All isolation and fractionation steps are performed at 4 degreesC to minimize proteolytic degradation of proteins.
Procedure
(Work in groups of four in steps A1–A2; work in pairs thereafter.)
Be sure to keep all beakers and buffers on ice. Note that there are four different media to be used: grinding buffer, breaking medium, resuspension medium and reaction mix. Note the differences among them. Be sure to use the correct solution. Read labels carefully throughout the experiment.
A. Preparation of thylakoid stock solution
1. Working in groups of 4 students at a bench, remove large stems and veins and unhealthy parts and then weigh 30g of spinach leaves. Tear leaves into 1-inch-wide strips. In a chilled blender, grind leaf tissue with 80mL ice-cold grinding medium for 5–10s at high speed. Filter the suspension into ice-cold beakers first through two, then eight layers of cheesecloth (the first filtration removes large debris, the second removes cell wall material and some nuclei). Gently squeeze the cheesecloth to express the liquid in both steps, then discard the cheesecloth and pulp in the garbage can. [Grinding medium: 100mM Tricine NaOH pH 7.8, 400mM sorbitol, 5mM MgCl2]
Clean Up: Rinse blender jar parts, beakers and stirrers with water immediately.
2. To isolate chloroplasts, divide the extract into two equal portions and pour them into two 50mL plastic round-bottom, capless centrifuge tubes. Balance the two tubes by transferring extract from the heavier tube to the lighter one, and centrifuge at 1000 x g in the SS34 rotor (see the conversion chart for RPMs) for 5min in the refrigerated (4ºC) centrifuge. After the spin, each pair of students continues with one of these tubes. From now on you are working in pairs. Carefully decant (pour off) the pale green supernatant and discard it. Save the green pellet (chloroplast-enriched fraction).
3. Using a glass rod, gently resuspend the pellets by mixing 1–2mL of breaking medium into the pellet. Make sure the pellet is completely detached from the wall and mixed into the resuspension. Avoid air bubbles (O2) that may oxidize enzymes and thereby reduce activity. The breaking medium is intended to shock the chloroplasts osmotically, thereby breaking open the organelles' outer membranes and releasing the stroma while leaving the thylakoid membranes intact. (Breaking medium: 20mM Tricine NaOH pH 7.8, 5mM MgCl2. Note the absence of sorbitol.)
4. Bring the resuspended pellets to a volume of about 25mL with cold breaking medium (50mL centrifuge tube half-full), balance against a tube of water, and centrifuge at 1900 x g for 5min. Discard the supernatant.
5. Resuspend the resulting pellet in 1.5mL of resuspension medium. This suspension is your stock preparation of thylakoids to be used in the Hill reaction. Keep it on ice. (Resuspension medium: 50mM Tricine NaOH pH 7.8, 100mM sorbitol, 5mM MgCl2).
Table 1. Composition of Media
| Type of Medium | Tricine NaOH pH 7.8 |
Sorbitol | MgCl2 | Sodium Phosphate pH 6.8 |
DCPIP | |
|---|---|---|---|---|---|---|
| Grinding | 100mM | 400mM | 5mM | — | — | |
| Breaking | 20mM | — | 5mM | — | — | |
| Resuspension | 50mM | 100mM | 5mM | — | — | |
| Reaction | — | 100mM | 5mM | 50mM | 0.05mM |
B. Running the Hill reaction (work in pairs)
1. Materials: Each pair will have a ring stand with a test tube holder, and a fiber-optic illuminator with a 150W quartz-halogen projection lamp. You will have to find the best arrangement to measure the reduction of DCPIP accurately and reproducibly. A handheld light meter and timer will be provided. Set up 5 ‘reaction tubes’ to begin with, adding 5mL of reaction mixture, but do not add the thylakoid membranes, which must be kept on ice. Add these thylakoid membranes just before each reaction mixture is tested. [Reaction mix: 50mM sodium phosphate, pH 6.8 buffer, 100mM sorbitol, 5mM MgCl2, 0.05mM DCPIP]
2. Blanking the Spectrophotometer (Appendix B): Use a tube containing 5mL of resuspension solution and 50µL of your thylakoid suspension to blank the Spec20 at 580nm (filter level to the left). With Parafilm® over the top of the tube, invert once to mix, then wipe the tube with a Kimwipe® before blanking the instrument. Do not vortex. You may need to prepare a fresh blank periodically.
3. Varying the Reaction Rate: The Hill reaction occurs at different rates depending on the amount of light supplied to the thylakoids. You will measure the reaction rate by taking absorbance readings over a 90s period in 15s intervals. We will use the drop in absorbance over time as a measure of the rate of the Hill reaction.
Depending on the number, distribution (clumped or not) and condition of thylakoids in your reaction tube, you may obtain varying reaction rates with a given amount of light. We measure the amount of light falling on the thylakoids using a hand-held light meter. The unit of measurement is the lux, which is the SI (Systéme Internationale) unit for illuminance. It is abbreviated as 'lx.'
Typically, the illuminance is set in the 1,000–3,000 lux range in order to drive the reaction at the desired rate—a drop in absorbance of 0.05–0.07 per 15s reading interval. The 15s interval consists of 10s of illumination and 5s to read the absorbance. In a 90s experiment, this data collection interval of 15s yields 7 data points (i.e., absorbance readings at time = 0, 15, 30, 45, 60, 75, and 90s). A typical absorbance reading at time = 0s is 0.8. If the drop in absorbance per 15s interval is 0.05, then at time = 90s, the absorbance reading should be 0.5.
You can vary the illuminance of the sample by varying the setting of the intensity knob on the fiber-optic illuminator. Your instructor will demonstrate how to measure the illuminance in units of lux. You will begin by running an experiment at 1,000 lux, taking readings every 15s for 90s. If the drop in A580 per 15s interval is <0.05, repeat the experiment, increasing the illuminance in steps of 1,000 lux, until you have obtained a reaction rate in the 0.05–0.07 A580–drop–per–15s range.
4. Measurement of Hill Reaction Rates: For each reaction tube, do the following in turn and work as rapidly as possible and in dim light. Mix thylakoid suspension gently by flicking bottom of tube.
5. Immediately remove 50µL of thylakoid suspension and add to a reaction tube containing 5mL of reaction solution, mix gently by inverting once and place tube in the Spec20 to obtain a "dark reading" with the spectrophotometer set at 580nm. This is the time = zero seconds absorbance reading. Take care not to shield the tube from the light with your hand.
6. Take absorbance readings every 15s (10s illumination + 5s reading) for 90s (7 readings). Record absorbance readings and times in your lab notebook. Repeat the experiment, i.e., do several 90s runs, until you obtain the desired reference rate of DCPIP reduction. Then repeat the experiment, to see if you can reproduce your data consistently.
7. Plotting the Data: The reduction of DCPIP is linear until the curve begins to level off near the end of the reaction. Since you are interested in the rate of DCPIP reduction, you are primarily concerned with the straight-line portion of the curve. To facilitate your comparison of the different rates of reaction, plot your data as a scatter graph, and add a trendline (simple linear regression: Appendix E). Include in your regression plots only data points that are in the linear portion of the curve. Do not include data points that are clearly in the leveled-off portion of the curve. Regression plots allow us to compare any two 90s experiments in a quantitative manner, using the slopes of the regression lines.
Laboratory Cleanup
1. Wash glassware and centrifuge tubes that have come in contact with chlorophyll as soon as possible using 70% ethanol.
2. Discard reaction mixtures in sink and test tubes in glassware disposal box.
3. Glass pipettes should be left to soak in the pipette canisters, tips down.
4. Place micropipette tips in the small orange bags at the bench.
5. Pasteur pipettes and cover slips go in the glass container (blue cardboard box).
6. Remove the last test tube from the sample chamber, and turn off your Spec20.
7. Quit out of all applications on your computer.
Assignment
In Lab 10, you and your partner will isolate thylakoids from spinach using the same protocol as you used today (Lab 9). You will then test the effects of varying one environmental parameter on the Hill reaction rate. Please sign up today to test the effects of one of the following parameters: temperature, illuminance, light wavelength, inhibitors or uncouplers. See Lab 10 for additional information. No more than two groups from each lab may choose to test the same parameter.
E-mail your proposed experiment to your lab instructor (cc your partner) early enough to leave time for feedback, modification of the proposal by you, resubmission of the proposal to your instructor, etc. Also, the prep staff needs sufficient time to provide the materials you require. Your compliance with this request will be factored into the grade that you will receive for the lab report based on this experiment.
Both partners should take part in composing the proposal, which should include:
– your hypothesis, controls, and expected results
– a list of reagents needed with protocols of how you will make all solutions used in your experiment
– your protocol (with sufficient detail, i.e., will there be replicates?, how to set up your tubes, etc.)
Your instructor will either approve your proposal, or suggest improvements.
