File:Cd11b 2.png
Original file (2,200 × 1,700 pixels, file size: 38 KB, MIME type: image/png)
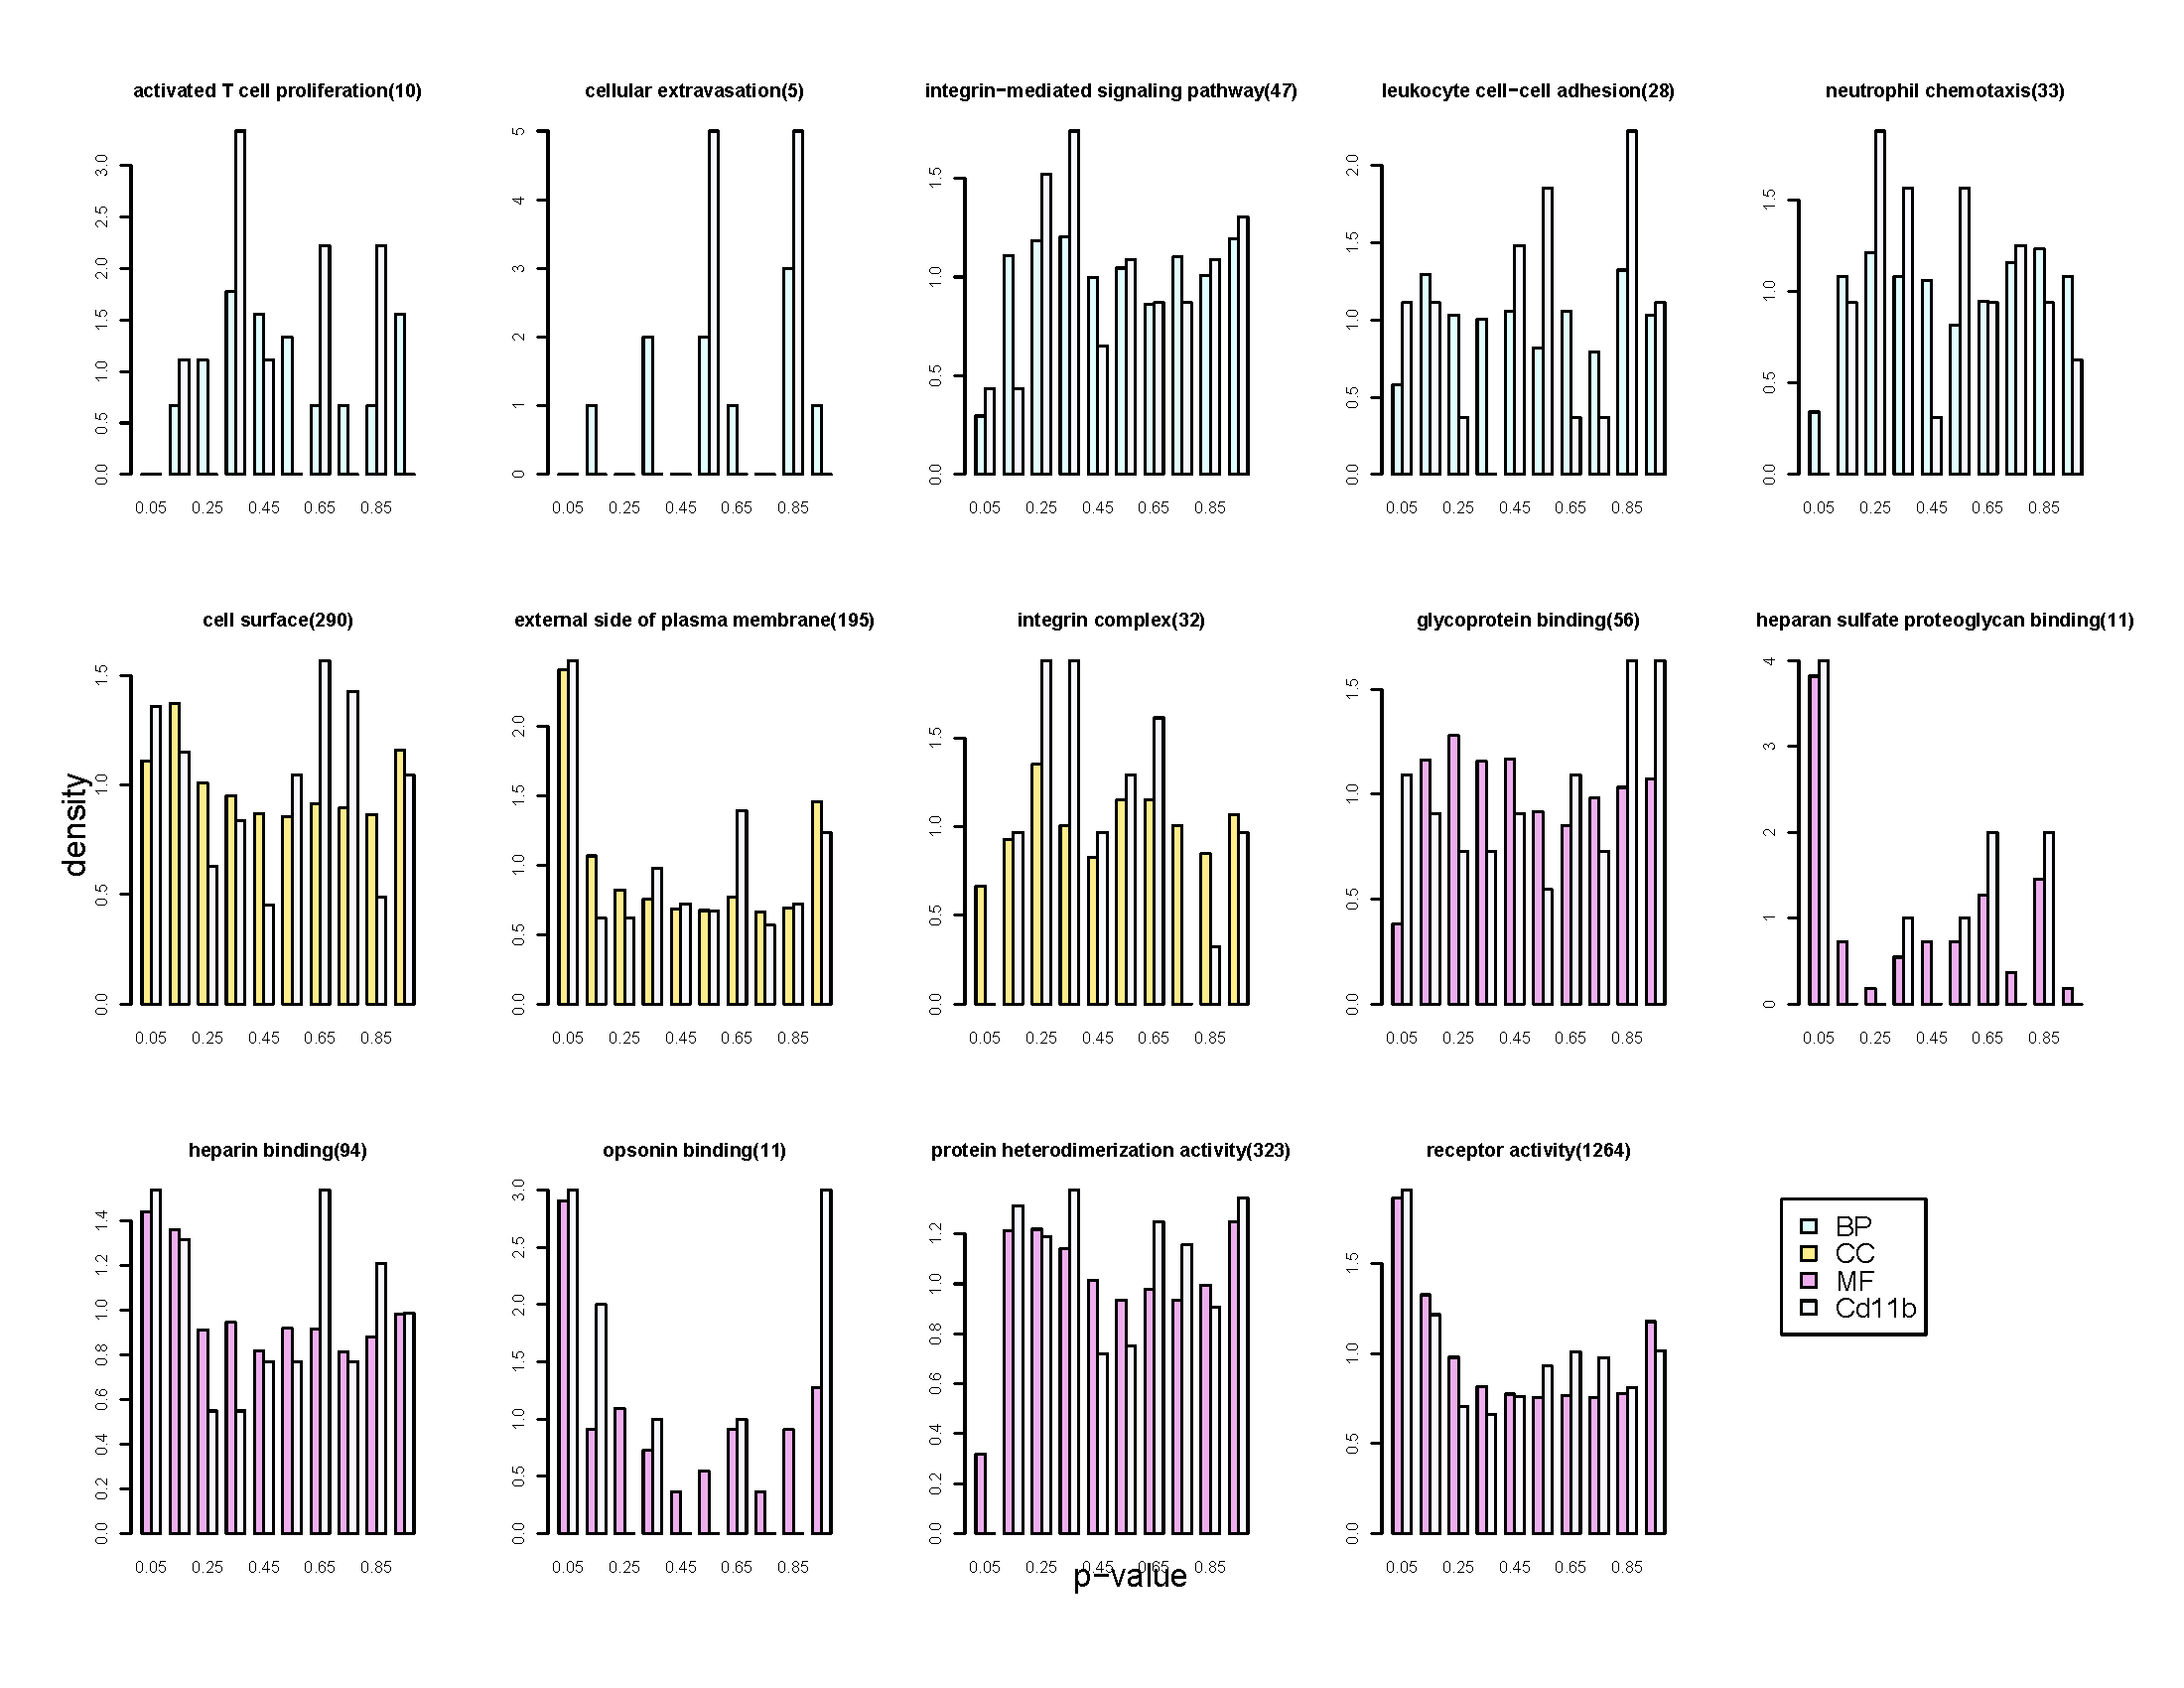
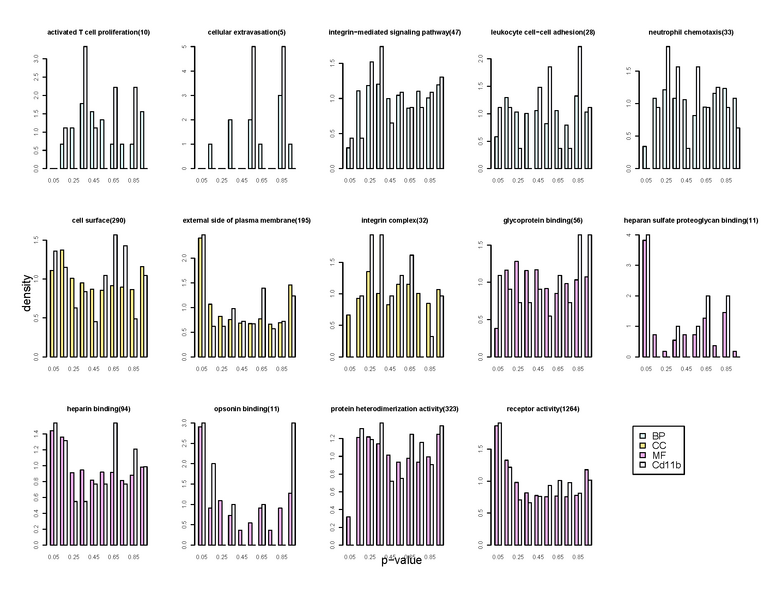
Figure 4. The distribution of Cd11b in the subsets filtered by GO term. Each color histogram stands for the distribution of whole genes, and that of Cd11b located divided by p-value versus density. The first three color bins is normalized to give the general idea of each GO term belongs: blue bin stands for the distribution of whole genes in ontology biological process (BP); yellow bin stands for cellular component (CC); and pink bin stands for molecular function (MF). The last grey bin stands for the distribution of Cd11b located in the subset. The amount of genes is presented in the bracket with the GO term.
File history
Click on a date/time to view the file as it appeared at that time.
| Date/Time | Thumbnail | Dimensions | User | Comment | |
|---|---|---|---|---|---|
| current | 13:43, 10 June 2010 | | 2,200 × 1,700 (38 KB) | Yu-Tien Cheng (talk | contribs) |
You cannot overwrite this file.
File usage
The following page uses this file:
