File:BarGraphAvg.PNG
From OpenWetWare
Jump to navigationJump to search
No higher resolution available.
BarGraphAvg.PNG (577 × 296 pixels, file size: 11 KB, MIME type: image/png)
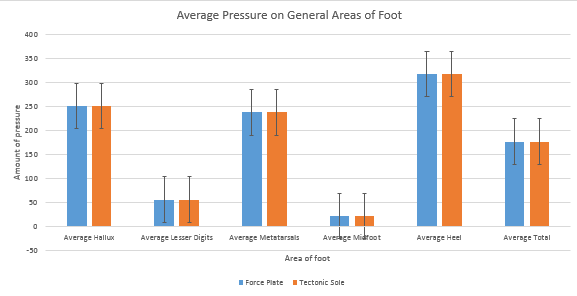
Graph 2. This graph compares the force plate and the Tectonic Sole's measurements of the points that have the most pressure applied on the foot.
File history
Click on a date/time to view the file as it appeared at that time.
| Date/Time | Thumbnail | Dimensions | User | Comment | |
|---|---|---|---|---|---|
| current | 03:53, 7 October 2015 | | 577 × 296 (11 KB) | Nimisha J. Tanna (talk | contribs) | Graph 2. This graph compares the force plate and the Tectonic Sole's measurements of the points that have the most pressure applied on the foot. |
You cannot overwrite this file.
File usage
There are no pages that use this file.
