File:4-30 control derivative.png
From OpenWetWare
Jump to navigationJump to search
Size of this preview: 772 × 600 pixels. Other resolution: 905 × 703 pixels.
Original file (905 × 703 pixels, file size: 26 KB, MIME type: image/png)
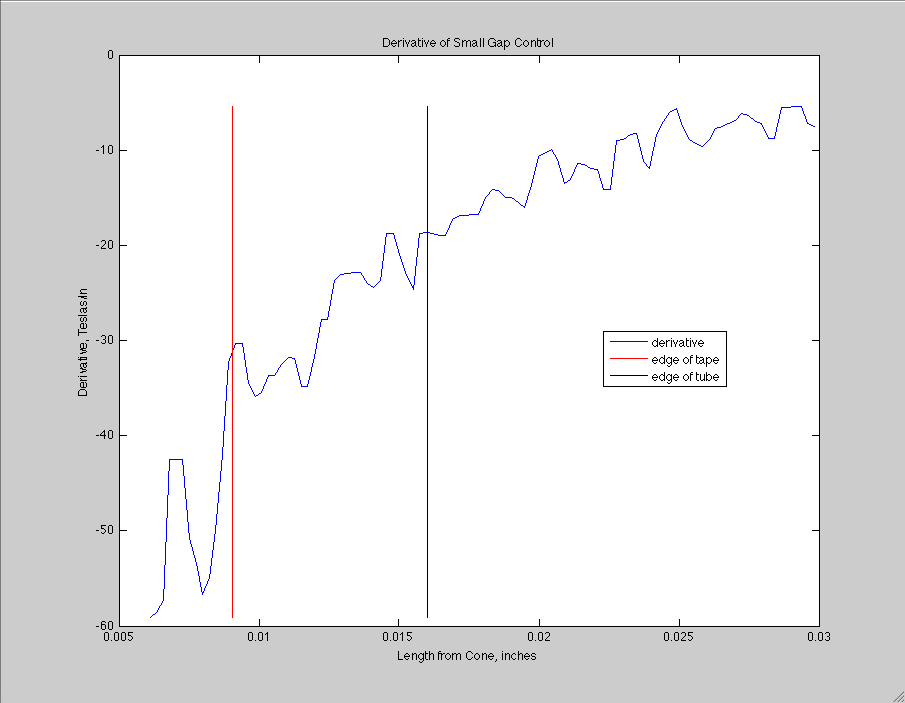
The derivative of the simulated field in the magnetic yoke as measured in Tesla per inch. Notice how there is a great amount of noise in the data, suggesting that there is a need for smoothing. Between the left side of the graph and the red line is the area representing where liquid would be present in a flow cell. The area to the right of the black line represents where the liquid would be in one of the thin walled micro-centrifuge tubes.
File history
Click on a date/time to view the file as it appeared at that time.
| Date/Time | Thumbnail | Dimensions | User | Comment | |
|---|---|---|---|---|---|
| current | 21:06, 30 April 2010 | | 905 × 703 (26 KB) | Brian P. Josey (talk | contribs) | The derivative of the simulated field in the magnetic yoke as measured in Tesla per inch. Notice how there is a great amount of noise in the data, suggesting that there is a need for smoothing. Between the left side of the graph and the red line is the ar |
You cannot overwrite this file.
File usage
The following page uses this file:
