User:Allison K. Alix/Notebook/Thesis Research/2013/06/27: Difference between revisions
From OpenWetWare
| Line 9: | Line 9: | ||
[[Image:Fluorescent beads corr curve image OWW.png]] | [[Image:Fluorescent beads corr curve image OWW.png]] | ||
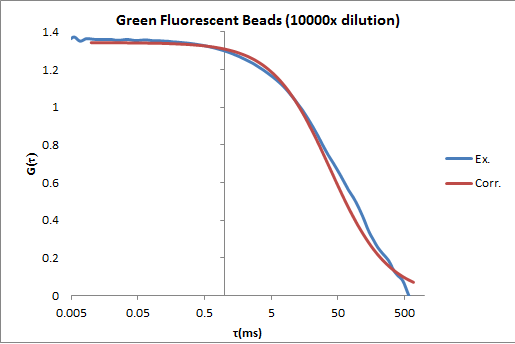
The above fluorescent correlation curve corresponds to a 20uL sample of 10,000x diluted green fluorescent beads. This sample was used to obtain correct alignment of the laser into the sample, as the beads are easily identifiable on the camera. A smooth curve indicates many are present. | |||
Revision as of 08:22, 1 July 2013
| <html><img src="/images/9/94/Report.png" border="0" /></html> Main project page <html><img src="/images/c/c3/Resultset_previous.png" border="0" /></html>Previous entry<html> </html>Next entry<html><img src="/images/5/5c/Resultset_next.png" border="0" /></html> | |
FCS dataThe above fluorescent correlation curve corresponds to a 20uL sample of 10,000x diluted green fluorescent beads. This sample was used to obtain correct alignment of the laser into the sample, as the beads are easily identifiable on the camera. A smooth curve indicates many are present.
| |
