User:Alexander Cvitan/Notebook/Experimental Biological Chemistry Lab/2014/03/18: Difference between revisions
From OpenWetWare
| Line 23: | Line 23: | ||
[[Image:Screen_Shot_2014-03-18_at_3.01.11_PM.png]] | [[Image:Screen_Shot_2014-03-18_at_3.01.11_PM.png]] | ||
[[Image:Screen_Shot_2014-03-18_at_3.01.57_PM.png]] | [[Image:Screen_Shot_2014-03-18_at_3.01.57_PM.png]] | ||
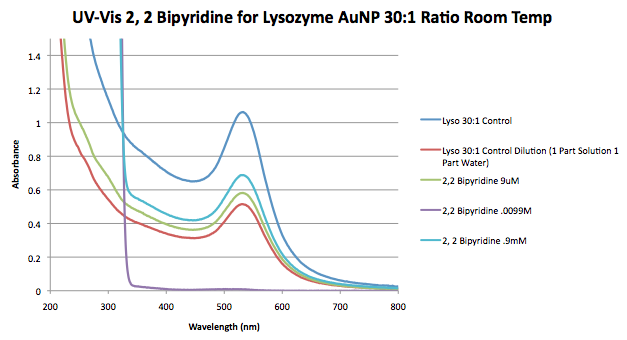
* Upon further inspection it appears that the tubes for 2,2 Bipyridine were mislabeled with different concentrators of variable than used in other tests. We were supposed to use .09, .9, and 9mM of variable. As a result, I'm not sure if the concentrations of variable are accurate or are just a mistake in labeling. This experiment should be repeated again. | * Upon further inspection it appears that the tubes for 2,2 Bipyridine were mislabeled with different concentrators of variable than used in other tests. We were supposed to use .09, .9, and 9mM of variable. As a result, I'm not sure if the concentrations of variable are accurate or are just a mistake in labeling. This experiment should be repeated again. For the sake of data analysis the concentrations listed on the tubes were used for data analysis and appear in the table below. | ||
[[Image:Screen_Shot_2014-03-19_at_3.14.08_PM.png]] | [[Image:Screen_Shot_2014-03-19_at_3.14.08_PM.png]] | ||
*Note that dilution of the control was not necessary. We realized afterwards that the control used to make this graph was not diluted like the variable samples, as a result, the actual absorbance at the peak is closer to were the peak with variable is. The table represented above reflects this dilution and made the calculations accordingly. | *Note that dilution of the control was not necessary. We realized afterwards that the control used to make this graph was not diluted like the variable samples, as a result, the actual absorbance at the peak is closer to were the peak with variable is. The table represented above reflects this dilution and made the calculations accordingly. | ||
Revision as of 19:00, 18 April 2014
 Biomaterials Design Lab: Spring 2014 Biomaterials Design Lab: Spring 2014
|
<html><img src="/images/9/94/Report.png" border="0" /></html> Main project page <html><img src="/images/c/c3/Resultset_previous.png" border="0" /></html>Previous entry<html> </html>Next entry<html><img src="/images/5/5c/Resultset_next.png" border="0" /></html> |
Objective
ImagesConductivity Readings of 30:1 Lysozyme-AuNP Samples with Variables Added After Baking
UV-Vis Lyso 30:1
| |


