|
Objective
- Determine the sensitivity of the Fluorometer using Ru(bpy)(phen) in acetonitrile.
- Determine Fluorescence of Maltose Binding Protein (MBP)
- Purify DNA from experiment performed on 9/27/2011
Description
- Ru(bpy)(phen) in Acetonitrile standards were made to determine sensitivity of instrument.
- Solutions A - E were prepared to determine fluorescence of Maltose Binding Protein (MBP).
- Ru(bpy)(phen) Standards (3 mL Total):
0 μM - 3 mL Acetanitrile
20 μM - .126 mL Ru(bpy) and 2.874 mL Acetanitrile
40 μM - .252 mL Ru(bpy) and 2.748 mL Acetanitrile
60 μM - .378 mL Ru(bpy) and 2.622 mL Acetanitrile
80 μM - .500 mL Ru(bpy) and 2.496 mL Acetanitrile
100 μM - .630 mL Ru(bpy) and 2.37 mL Acetanitrile
- Spectra for the standards were measured at 300 - 700 nm with excitation at 450 nm
- MBP Solutions (3 mL Total):
A - 1397 μL MBP and 1603 uL Tris Buffer pH 7.55
B - 300 μL Solution A and 2700 μL Tris
C - 300 μL Solution B and 2700 μL Tris
D - 300 μL Solution C and 2700 μL Tris
E - 300 μL Solution C and 2700 μL Tris
- Spectra for the solutions were measured at 310 - 500 nm with excitation at 290 nm
- DNA Purification procedure was from "Wizard® Plus SV Minipreps DNA Purification System":
[1]
Data
- Using excel, the curves were integrated
0 μM - 11.9577785
20 μM - 1742.89187
40 μM - 2239.60778
60 μM - 2462.69942
80 μM - 2474.32617
100 μM - 2391.34271
- Fluorescence intensity values were plotted against wavelength. Near 60 μM, Ru(bpy)(phen) emission is at it's maximum.

- Plot of integrated intensity against concentration of Ru(bpy)(phen).

- Fluorescence spectra of MBP Solutions A, B, C, D, and E:

- Absorbance spectra of MBP Solutions A, B, C, D, and E.

- Using the absorbance spectra of the MBP solutions at 280 nm, along with the molar absorptivity of MBP calculated on 9/14/2011, the concentration of MBP in each solution was calculated.
Solution A - 1.09306*10^-5 M
Solution B - 1.08887*10^-6 M
Solution C - 1.67518*10^-7 M
Solution D - 4.18796*10^-8 M
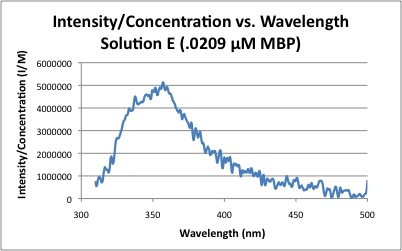
Solution E - 2.09398*10^-8 M
- Intensity/Concentration of each MBP solution was plotted against the wavelength.


Notes
- Solutions A and B have concentrations of MBP that are too high for the flourimeter to read which is why their curves are flat.
- The baselines for solutions D and E were changed slightly to avoid having negative concentrations.
|  Chem-571


